Freight News:
Unfasten your seat belts
This week’s FreightWaves Supply Chain Pricing Power Index: 30 (Shippers)
Last week’s FreightWaves Supply Chain Pricing Power Index: 30 (Shippers)
Three-month FreightWaves Supply Chain Pricing Power Index Outlook: 30 (Shippers)
The FreightWaves Supply Chain Pricing Power Index uses the analytics and data in FreightWaves SONAR to analyze the market and estimate the negotiating power for rates between shippers and carriers.
This week’s Pricing Power Index is based on the following indicators:
The flip of a coin
Against significant odds, the Federal Reserve might realize its once-unlikely goal of a “soft landing” — that is, taming inflation without also triggering a recession. Freight demand is returning with a vengeance: Accepted volumes are outpacing the levels of 2019 and 2020 just in time for the back-to-school shopping season. But sentiment for the upcoming peak season remains mixed among analysts, with no consensus as to whether the market will sustain its momentum throughout the rest of the year.

SONAR: OTVI.USA: 2023 (white), 2022 (blue) and 2021 (green)
To learn more about FreightWaves SONAR, click here.
This week, the Outbound Tender Volume Index (OTVI), which measures national freight demand by shippers’ requests for capacity, rose 4.75% on a week-over-week (w/w) basis. On a year-over-year (y/y) basis, OTVI is down 9.36%, though such y/y comparisons can be colored by significant shifts in tender rejections. OTVI, which includes both accepted and rejected tenders, can be inflated by an uptick in the Outbound Tender Reject Index (OTRI).

SONAR: CLAV.USA: 2023 (white), 2022 (blue) and 2021 (green)
To learn more about FreightWaves SONAR, click here.
Contract Load Accepted Volume (CLAV) is an index that measures accepted load volumes moving under contracted agreements. In short, it is similar to OTVI but without the rejected tenders. Looking at accepted tender volumes, we see a gain of 4.55% w/w as well as a fall of 6.92% y/y. This y/y difference confirms that actual cracks in freight demand — and not merely OTRI’s y/y decline — are driving OTVI lower.
Good news of rising truckload activity aside, there are some worrying signals from the demand side of the economy. While the U.S.’ gross domestic product rose 2.4% on an annualized basis in the second quarter of 2023 — thus avoiding the negative growth characteristic of a recession — its gains were realized primarily from business investments. Consumer spending on freight-intensive goods cooled from 6% y/y growth in Q1 to 0.7% y/y in Q2. Spending on bulky durable goods, like furniture and home appliances, took an even greater dive from Q1’s 16.3% y/y growth to Q2’s 0.4% y/y growth.
How the economy will fare over the coming year is still an open question. A recent survey of 52 economists by the National Association for Business Economics showed that 71% of respondents believed that the odds of a recession in the next 12 months is 50% or less. But another report from the Conference Board stated that, though “it is possible that a soft landing may be achievable,” the group believes “a short and shallow recession is the more probable outcome,” likely commencing in Q4 of this year. Yet another survey of 69 economists from The Wall Street Journal put the odds of a near-term recession at 54%, down from 61% in the two previous surveys. In short: It is still anyone’s guess what the future will hold.
This aura of uncertainty has not prevented some industry analysts from making gloomy forecasts. Kuehne+Nagel, the world’s largest logistics provider, stated its prediction that “there is no peak season to be expected in 2023,” citing weakness in demand signals for both air cargo and ocean freight. Packaged food companies are also seeing a slowdown in retailers’ demand, given how elevated interest rates have effected a higher cost of holding inventory. Yet consumers have proven resilient in the face of adverse conditions, so there remains a potential for surprise to the upside during the upcoming holiday shopping season.

SONAR: Outbound Tender Volume Index – Weekly Change (OTVIW).
To learn more about FreightWaves SONAR, click here.
Of the 135 total markets, 93 reported weekly increases in tender volumes, with some of the largest gains held by midsize markets.
The clear winner of the week was Phoenix — now the eighth-largest market by outbound volume, just behind Detroit and Los Angeles but ahead of Elizabeth, New Jersey, and Joliet, Illinois. Yet the overwhelming majority of Phoenix’s recent increase in freight demand was had by loads moving fewer than 100 miles with low lead times, suggesting that the uptick was caused by a short-term repositioning project. That said, Phoenix has seen a great deal of activity in 2023 so far and the market is heating up.
By mode: The reefer market continues to soften, even as a heat wave blankets two-thirds of the U.S. population. Ordinarily, reefers take some market share away from dry vans during bouts of extreme temperatures (whether heat or cold), since shippers seek to protect their freight from damage. That the Reefer Outbound Tender Volume Index (ROTVI) is down 1% w/w and 5.6% from June implies that the end of produce season is a far greater headwind than the tailwind of this heat wave.
Van volumes, on the other hand, are doing quite well. The Van Outbound Tender Volume Index (VOTVI) is up 6.6% w/w and 9.3% over June, which is a welcome sight for carriers. Even so, VOTVI is down 7.2% y/y given the deterioration of van rejection rates over that same period.
Falling dominoes
After an alarming dip in the middle of the month, rejection rates are again gaining distance from mid-May’s cycle low. This current rally, such as it is, does reflect rising freight demand but — as discussed below — has yet to translate into much-needed momentum for spot rates.

SONAR: OTRI.USA: 2023 (white), 2022 (blue) and 2021 (green)
To learn more about FreightWaves SONAR, click here.
Over the past week, OTRI, which measures relative capacity in the market, rose to 3.23%, a change of 29 basis points (bps) from the week prior. OTRI is now 328 bps below year-ago levels, with y/y comparisons becoming only more favorable as the year progresses.
Earlier this week, Surge Transportation — a Florida-based digital freight brokerage with nearly 200 employees — filed for Chapter 11 bankruptcy, displaying the struggle that brokers and carriers face when overexposed to volatile spot markets. Prior to the filing, Surge sought to be acquired but failed to find a buyer. Surge owes roughly $12 million in unpaid claims to 5,000 trucking companies, though recompense is unlikely as carriers are labeled unsecured creditors during bankruptcy proceedings.
Despite a stay of execution late last week, Yellow announced to its employees that it is preparing to file for bankruptcy on Monday. After the market closed on Thursday, Yellow announced that it is divesting its logistics division, which does not have a unionized workforce, and has been propositioning multiple buyers for the unit. In preparation for a bankruptcy filing, Yellow told its employees that the company was “limiting pick-up operations in all terminals.” On Friday, Yellow laid off an unknown number of employees in sales, information technology and customer service.

SONAR: WRI (color)
To learn more about FreightWaves SONAR, click here.
The map above shows the Weighted Rejection Index (WRI), the product of the Outbound Tender Reject Index — Weekly Change and Outbound Tender Market Share, as a way to prioritize rejection rate changes. As capacity is generally finding freight this week, only one region posted a blue market, which are usually the ones to focus on.
Of the 135 markets, 87 reported higher rejection rates over the past week, though 57 of those saw increases of only 100 or fewer bps.

To learn more about FreightWaves SONAR, click here.
By mode: Flatbed rejection rates have recovered somewhat over the past 10 days, though they still remain below the previous quarter’s average of 12.16%. Summer is typically a busy season for construction, but housing starts took a blow in June, falling 8% from May. Despite this weakness, U.S. homebuilders are optimistic that the worst is behind them. A sentiment index from the National Association of Home Builders ticked up to 56 in July from 55 in June — both far from December’s low of 31 and the highest reading since June 2022. The Flatbed Outbound Tender Reject Index (FOTRI) is up 128 bps w/w at 10.15%.
Rejection rates for dry vans and reefers are also bouncing back from an earlier dip. The Reefer Outbound Tender Reject Index (ROTRI) remains comfortably above Q2’s average of 3.65%, as ROTRI gained an impressive 81 bps w/w to reach 4.19%. The Van Outbound Tender Reject Index (VOTRI) is similarly outperforming its Q2 average of 2.8%, having risen 25 bps w/w to 3.1%.
Contract carriers warn of Q3 softness
With Yellow’s bankruptcy proceeding on a (relatively speaking) less chaotic timeline and a Teamsters strike at UPS averted, two potential sources of upward pressure on truckload spot rates have failed to materialize. There is still hope that rising freight demand during the upcoming peak season — such as it might be — will thumb the scales for carriers, especially if it is coupled with continuing gains in rejection rates. In the meantime, spot rates have fallen below their average in the previous quarter.
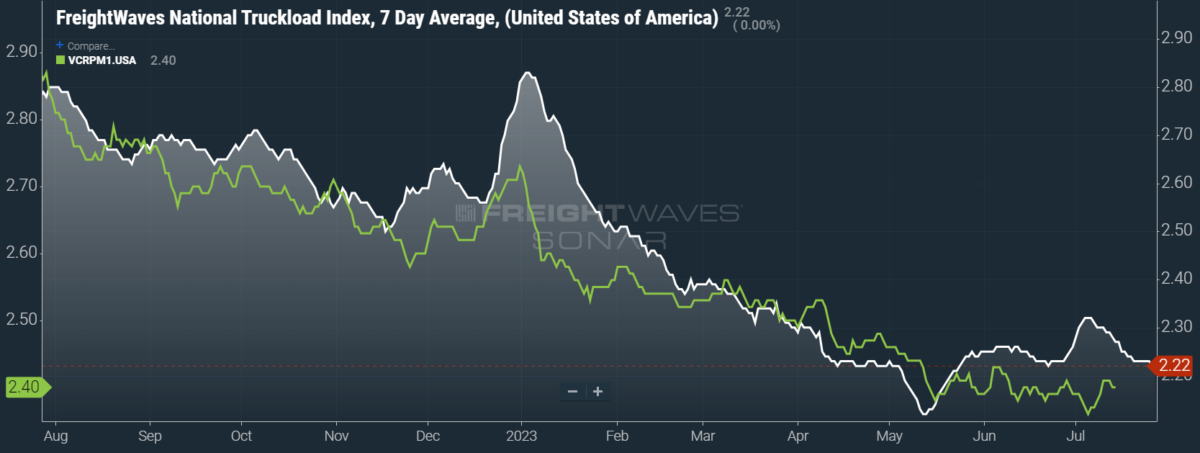
SONAR: National Truckload Index, 7-day average (white; right axis) and dry van contract rate (green; left axis).
To learn more about FreightWaves SONAR, click here.
This week, the National Truckload Index (NTI) — which includes fuel surcharges and other accessorials — fell 1 cent per mile to $2.22. Falling linehaul rates were the sole culprit behind that tumble, as the linehaul variant of the NTI (NTIL) — which excludes fuel surcharges and other accessorials — also fell 1 cent per mile w/w to $1.62.
Contract rates are reported on a two-week delay, but data from mid-July shows that they have yet to settle into their quarterly pace. Major carriers and 3PLs alike have cautioned that Q3 is likely to host a soft contract market, lowering their earnings guidance for the period. In any case, contract rates — which exclude fuel surcharges and other accessorials like the NTIL — have risen 3 cents per mile w/w to $2.40.

To learn more about FreightWaves SONAR, click here.
The chart above shows the spread between the NTIL and dry van contract rates, revealing the index has fallen to all-time lows in the data set, which dates to early 2019. Throughout that year, contract rates exceeded spot rates, leading to a record number of bankruptcies in the space. Once COVID-19 spread, spot rates reacted quickly, rising to record highs seemingly weekly, while contract rates slowly crept higher throughout 2021.
Despite this spread narrowing significantly early in the year, tightening by 20 cents per mile in January, it has widened again throughout the year to date. As linehaul spot rates remain 73 cents below contract rates, there is still plenty of room for contract rates to decline — or for spot rates to rise — in the remainder of the year.

To learn more about FreightWaves TRAC, click here.
The FreightWaves Trusted Rate Assessment Consortium (TRAC) spot rate from Los Angeles to Dallas, arguably one of the densest freight lanes in the country, has seen a slowdown in its prior momentum. Over the past week, the TRAC rate remained unchanged at $2.20 — still a distance from its year-to-date high of $2.39. The daily NTI (NTID), which has ticked down to $2.21, is barely outpacing rates along this lane.

To learn more about FreightWaves TRAC, click here.
On the East Coast, especially out of Atlanta, rates have come down from July’s early peak but are still outpacing the NTID. The FreightWaves TRAC rate from Atlanta to Philadelphia has tumbled 7 cents per mile w/w to $2.51. After a bull run that started at the end of April, this lane was plateauing above the national average, which made north-to-south lanes in the East far more attractive than West Coast alternatives.
For more information on FreightWaves’ research, please contact Michael Rudolph at mrudolph@freightwaves.com or Tony Mulvey at tmulvey@freightwaves.com.
The post Unfasten your seat belts appeared first on FreightWaves.
Source: freightwaves - Unfasten your seat belts
Editor: Michael Rudolph