Freight News:
Under pressure
This week’s FreightWaves Supply Chain Pricing Power Index: 35 (Shippers)
Last week’s FreightWaves Supply Chain Pricing Power Index: 35 (Shippers)
Three-month FreightWaves Supply Chain Pricing Power Index Outlook: 35 (Shippers)
The FreightWaves Supply Chain Pricing Power Index uses the analytics and data in FreightWaves SONAR to analyze the market and estimate the negotiating power for rates between shippers and carriers.
This week’s Pricing Power Index is based on the following indicators:
A return to normalcy?
In the first half of September, volume trends mirrored those of both 2019, the year of the industry’s last recession, and 2021, arguably the busiest year for freight on record. After a strong close to the month, current trends resemble 2021 more than anything else: By next week, it is likely that actual freight flow will have finally risen on a yearly basis for the first time since May 2022. There is no one single cause for this recovery — in fact, consumer confidence declined substantially in September — but market data broadly suggests a simple return to normal, seasonal trends.
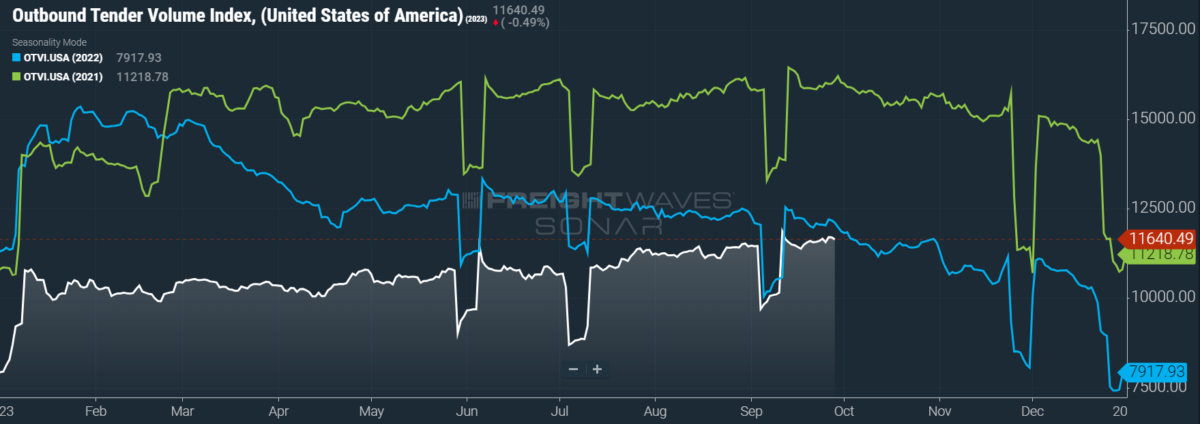
SONAR: OTVI.USA: 2023 (white), 2022 (blue) and 2021 (green)
To learn more about FreightWaves SONAR, click here.
This week, the Outbound Tender Volume Index (OTVI), which measures national freight demand by shippers’ requests for capacity, rose 0.68% week over week (w/w). On a year-over-year (y/y) basis, OTVI is down 2.86%, though such y/y comparisons can be colored by significant shifts in tender rejections. OTVI, which includes both accepted and rejected tenders, can be inflated by an uptick in the Outbound Tender Reject Index (OTRI).
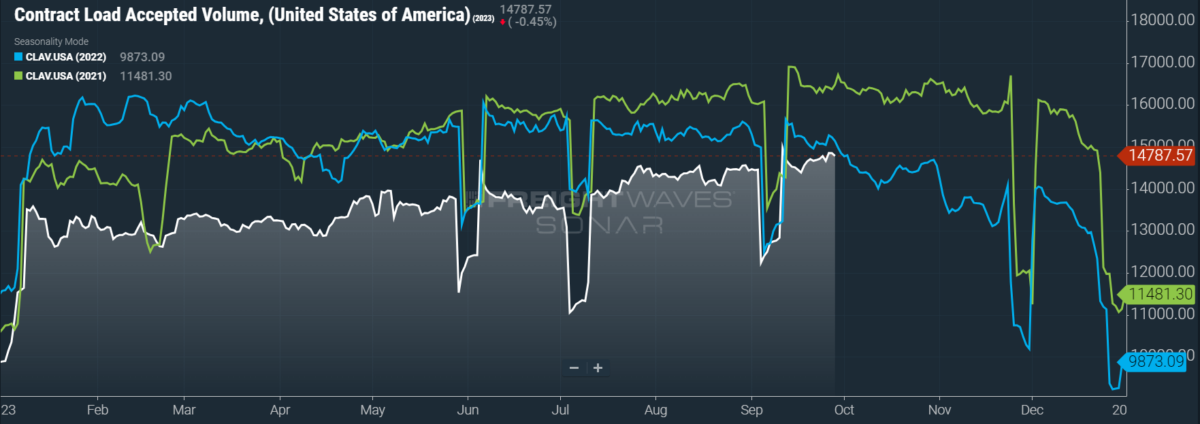
SONAR: CLAV.USA: 2023 (white), 2022 (blue) and 2021 (green)
To learn more about FreightWaves SONAR, click here.
Contract Load Accepted Volume (CLAV) is an index that measures accepted load volumes moving under contracted agreements. In short, it is similar to OTVI but without the rejected tenders. Looking at accepted tender volumes, we see a rise of 0.97% w/w as well as a fall of 2.47% y/y. This narrowing y/y difference implies that actual freight flow is recovering from this cycle’s bottom.
The second revision to quarterly data on gross domestic product is not often a noteworthy affair, since it arrives three months after a given quarter and is typically an insubstantial edit. But GDP data for Q2 2023, which covers the period from April through June, has proven an exception. The most concerning revision was made to real (i.e., inflation-adjusted) consumer spending in the first half of the year, as current data now suggests significantly less momentum than before. Personal consumption in Q2 was revised to 0.8% annualized growth, down 80% from Q1’s growth of 3.1% and less than half of the previous estimate’s 1.7% growth.
Why does this figure matter? Consumer spending is the engine of the U.S. economy, accounting for nearly three-quarters of all economic output. The consumer already faces numerous headwinds heading into Q4: rising oil prices, the resumption of student loan payments, the ongoing (and expanding) labor strike against auto manufacturers that will put upward pressure on vehicle prices and the potential for a government shutdown, to name a few. If consumer resilience is threatened, so too is the future of freight demand.
As mentioned previously, consumer confidence is crumbling at an inopportune time. Per the Conference Board’s monthly survey, expectations for near-term health — in income, business activity and labor market conditions — fell in September below the level that historically indicates a recession within the next year. The growing caution of the U.S. consumer is likely to impact the upcoming holiday season in one of two ways: either there will be one last credit-fueled hurrah in discretionary spending or weakened demand will be felt immediately. (The third option, that holiday spending is simply middling, also remains a distinct possibility.)
After their inventory nightmares of the past year, it is safe to assume that retailers are as attentive to shifts in consumer demand as they can be. So, while any immediate disruption to consumer-driven freight demand is not ideal since it risks upsetting the nascent recovery of carrier rates, it holds the potential for the quickest return to normalcy in the front half of 2024. Much more worrisome is if Q4 freight demand is surprisingly robust, as it would imply either that shippers misjudged demand from their customers (unlikely, but possible) or that consumers are stretching themselves too thin. Either scenario is ultimately robbing Peter to pay Paul, as freight demand will suffer in the coming year.
Is there any good news? Recent card spending data from Bank of America shows that consumer spending already started to decelerate after Labor Day. Credit card usage is falling on a y/y basis while debit card spending is rising only slightly. There are, however, two notable exceptions to this downward trend: Online purchases of electronics, which are typically big-ticket items, and department store spending are noticeably up 4% y/y and 4.8% y/y, respectively. On the whole, however, total card spending is down 0.3% y/y.
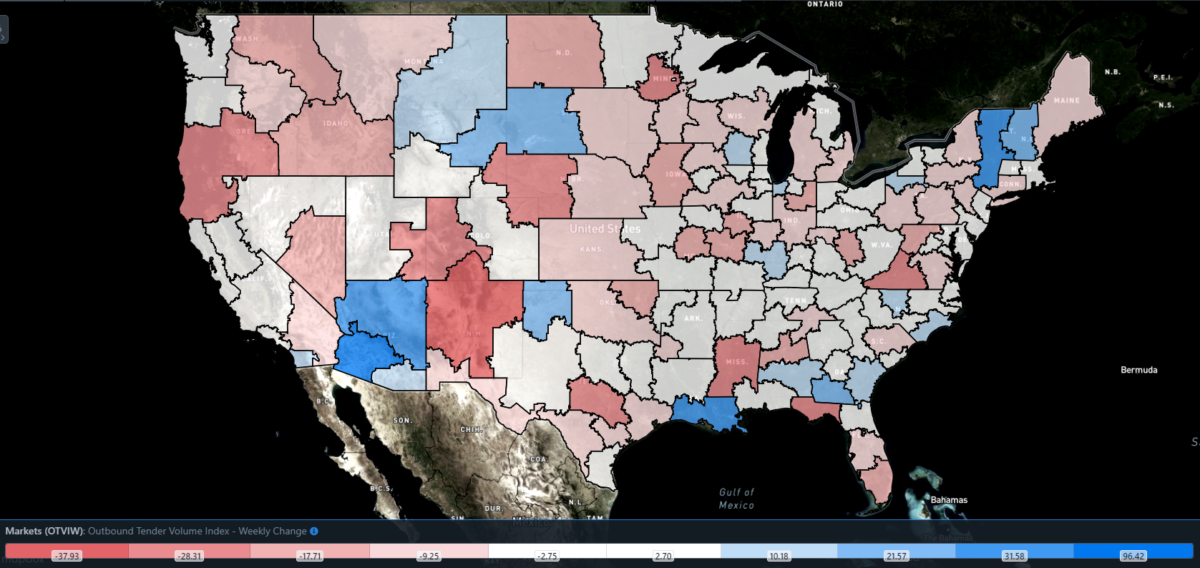
SONAR: Outbound Tender Volume Index – Weekly Change (OTVIW).
To learn more about FreightWaves SONAR, click here.
Of the 135 total markets, 63 reported weekly increases in tender volumes, though the lion’s share of heavyweight markets saw slight declines in freight activity.
The most noteworthy market this week was, by far, that of Phoenix. Phoenix has rapidly garnered a reputation as a burgeoning hub for logistics as it has become one of the fastest-growing markets for industrial real estate over the past few years. This week, outbound tenders from Phoenix rose 96.4% w/w, though there is a caveat for long-haul truckers: The vast majority of these loads are local, moving fewer than 100 miles, and Phoenix’s average lead time for outbound shipments just shrank from 2.5 to 1.75 days. Taken together, this data suggests a kind of short-term repositioning project that is not indicative of future strength at this level. Even so, Phoenix is a developing market that often presents these kinds of opportunities.
By mode: Reefer demand has continued to plummet in the latter half of September, mirroring trends from last year. If this comparison still holds true over the coming weeks, reefer volumes should stabilize in the first two-thirds of October before rising in the run-up to November, after which demand will plateau until Thanksgiving. For the time being, however, the Reefer Outbound Tender Volume Index (ROTVI) is down 2.48% w/w.
As is the case with the overall OTVI, van volumes are looking healthy and are likely to surpass 2022 levels by the first week of October. Given its heightened exposure to consumer activity, dry van demand will give the clearest picture of spending trends in the weeks to come. Again, a boring but stable performance is still in the cards, and so the Van Outbound Tender Volume Index (VOTVI) could reflect a nominal peak season. VOTVI is currently up 2.04% w/w.
Government shutdown could open up opportunities for carriers
Disappointingly, rejection rates tumbled along a protracted slide since peaking in early September, though OTRI yet remains in line with March’s highest reading. If OTRI remains strictly buffeted by seasonal trends, it is likely that it will continue to fall further: Even in the busy year of 2021, OTRI did not see any upward movement worth mentioning until the back half of December. That said, OTRI did see a significant recovery in 2019 as early as mid-November. Near-term potential for chaos could accelerate this timeline.
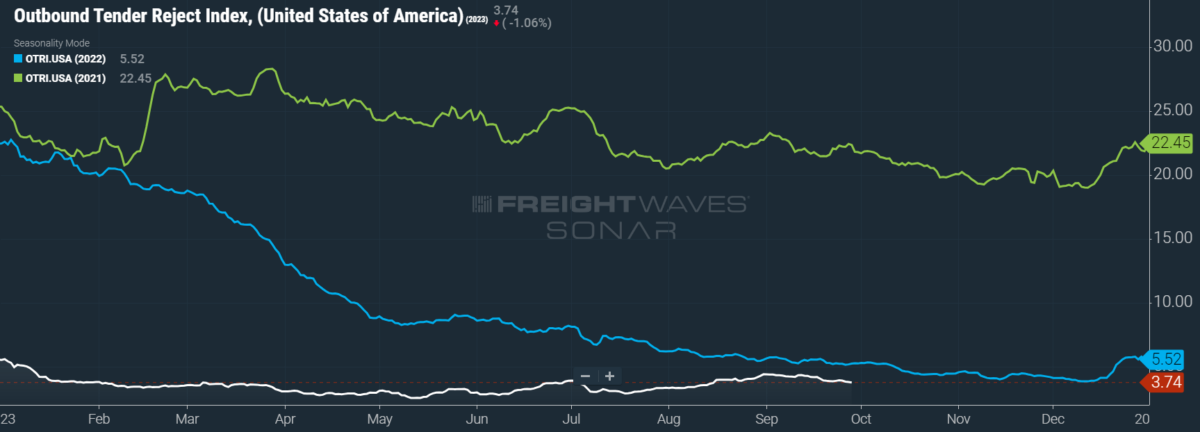
SONAR: OTRI.USA: 2023 (white), 2022 (blue) and 2021 (green)
To learn more about FreightWaves SONAR, click here.
Over the past week, OTRI, which measures relative capacity in the market, fell to 3.74%, a change of 11 basis points from the week prior. OTRI is now 148 bps below year-ago levels, with y/y comparisons becoming more favorable even if OTRI just remains stable.
Although trucking has been a highly deregulated industry since 1980, it nevertheless deals with regulatory bodies like the Surface Transportation Board and Customs and Border Protection. Such dealings could be compromised by a government shutdown lasting more than a few days, the likelihood of which is growing as the Saturday deadline looms. While a brief shutdown should not greatly disrupt freight flow, there are some pain points: Certain shipments that fall under the purview of government agencies might be delayed at the border, if they do not fail to clear altogether. More importantly, however, the general atmosphere of volatility could be a blessing to carriers that project confidence in navigating the chaos.

SONAR: WRI (color)
To learn more about FreightWaves SONAR, click here.
The map above shows the Weighted Rejection Index (WRI), the product of the Outbound Tender Reject Index – Weekly Change and Outbound Tender Market Share, as a way to prioritize rejection rate changes. As capacity is generally finding freight this week, only a few regions posted blue markets, which are usually the ones to focus on.
Of the 135 markets, 67 reported higher rejection rates over the past week, though 49 of those saw increases of only 100 or fewer bps.
To learn more about FreightWaves SONAR, click here.
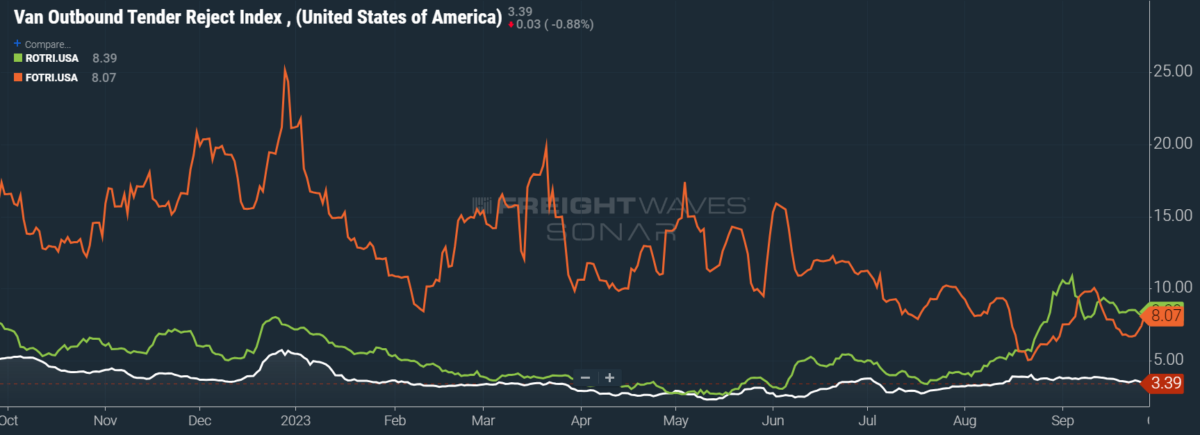
By mode: Flatbed demand is struggling against a number of headwinds, such as an industrial economy brought to heel by high federal interest rates and the slowing construction sector. The Flatbed Outbound Tender Reject Index (FOTRI) did rise 125 bps w/w to 8.07%, but its ceiling appears to be within the single digits for now — a far cry from its reading at 16% at this time last year.
In contrast to current trends in reefer volume, reefer rejection rates have remained fairly stable over the past month. The Reefer Outbound Tender Reject Index (ROTRI), which rose 4 bps w/w to 8.39%, is even outpacing FOTRI for the first time since early 2022. Van rejection rates, meanwhile, have returned to the levels of early August, with the Van Outbound Tender Reject Index (VOTRI) sliding 15 bps w/w to 3.39%.
Is it over yet?
Regarding the future of diesel prices, the mood has shifted from sleepless nail-biting to relieved sighs at breakneck speed. Even though a persisting imbalance between supply and demand continues to put upward pressure on oil prices, oil traders have proven skittish at extending the rally to $100 per barrel, fearing that Saudi Arabia might reverse its production cuts sooner than anticipated. Retail diesel prices have already started to decline but — with only a week’s worth of downward movement — it is still too soon to call the top.

SONAR: National Truckload Index, 7-day average (white; right axis) and dry van contract rate (green; left axis).
To learn more about FreightWaves SONAR, click here.
This week, the National Truckload Index (NTI) — which includes fuel surcharges and other accessorials — fell 2 cents per mile to $2.26. Sliding linehaul rates were only half responsible for this decline, as the linehaul variant of the NTI (NTIL) — which excludes fuel surcharges and other accessorials — fell 1 cent per mile w/w to $1.56.
Contract rates, which are reported on a two-week delay, have moderated after their Labor Day bump, albeit at a level comfortably above their early August low of $2.31 per mile. Since contract rates treat fuel costs as a pass-through, they are largely exempt from drama surrounding diesel prices. Instead, their biggest determinant will be the direction of Q4’s bid cycle, which will be reflected in data from late October. For the time being, contract rates — which exclude fuel surcharges and other accessorials like the NTIL — are up 1 cent per mile w/w at $2.36.
To learn more about FreightWaves SONAR, click here.
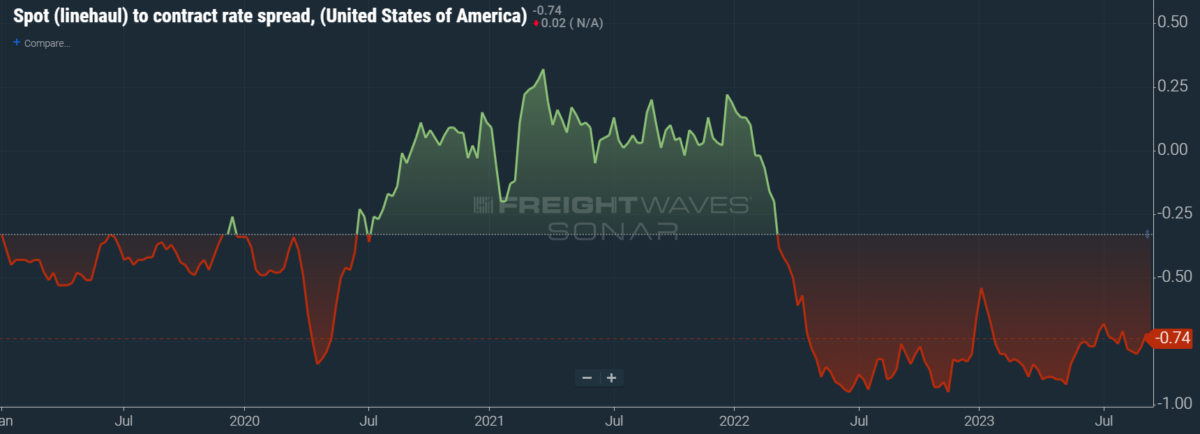
The chart above shows the spread between the NTIL and dry van contract rates, revealing the index has fallen to all-time lows in the data set, which dates to early 2019. Throughout that year, contract rates exceeded spot rates, leading to a record number of bankruptcies in the space. Once COVID-19 spread, spot rates reacted quickly, rising to record highs seemingly weekly, while contract rates slowly crept higher throughout 2021.
Despite this spread narrowing significantly early in the year, tightening by 20 cents per mile in January, it has widened again throughout the year to date. As linehaul spot rates remain 74 cents below contract rates, there is still plenty of room for contract rates to decline — or for spot rates to rise — in the remainder of the year.
To learn more about FreightWaves TRAC, click here.
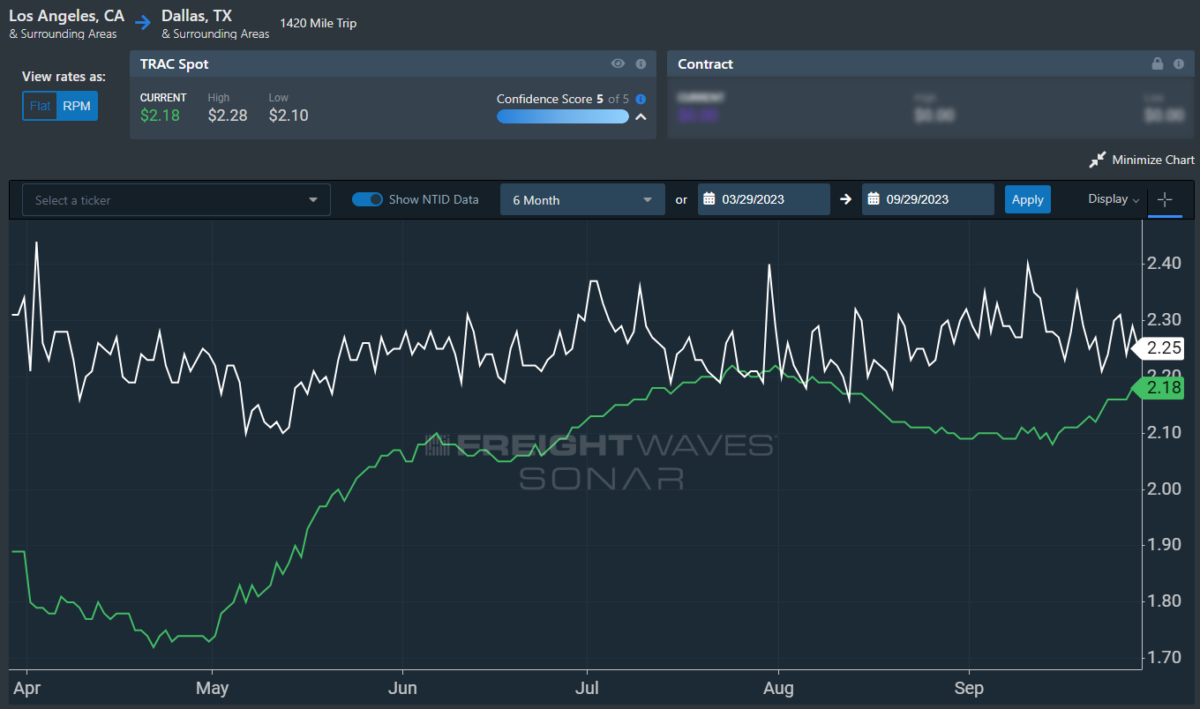
The FreightWaves Trusted Rate Assessment Consortium (TRAC) spot rate from Los Angeles to Dallas, arguably one of the densest freight lanes in the country, is finding its footing once again. Over the past week, the TRAC rate rose 6 cents per mile to $2.18 — still some distance from its year-to-date high of $2.39. The daily NTI (NTID), which has fallen to $2.25, is handily outpacing rates along this lane.
To learn more about FreightWaves TRAC, click here.
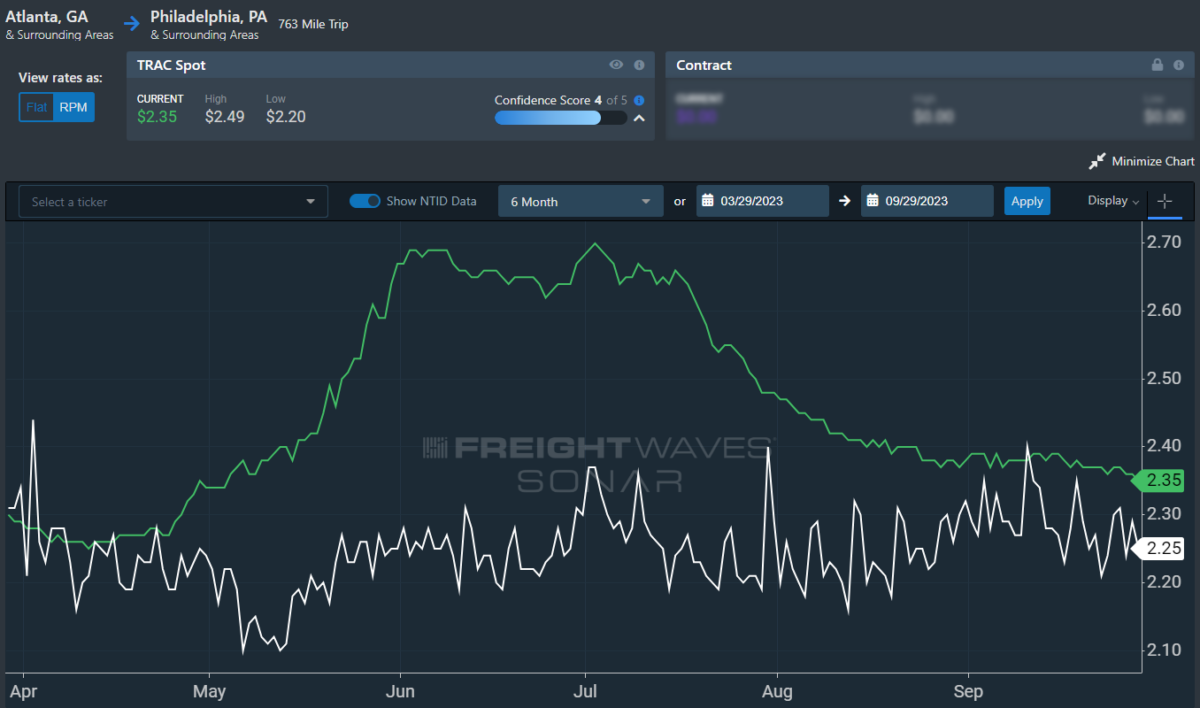
On the East Coast, especially out of Atlanta, rates have come down from July’s early peak but are still outpacing the NTID. The FreightWaves TRAC rate from Atlanta to Philadelphia fell 1 cent per mile to $2.36. After a bull run that started at the end of April, this lane had been plateauing above the national average, which made north-to-south lanes in the East far more attractive than West Coast alternatives.
For more information on FreightWaves’ research, please contact Michael Rudolph at mrudolph@freightwaves.com or Tony Mulvey at tmulvey@freightwaves.com.
The post Under pressure appeared first on FreightWaves.
Source: freightwaves - Under pressure
Editor: Michael Rudolph