Freight News:
Truckload market only in early stages of easing

Contract truckload volumes did not take a hit in March
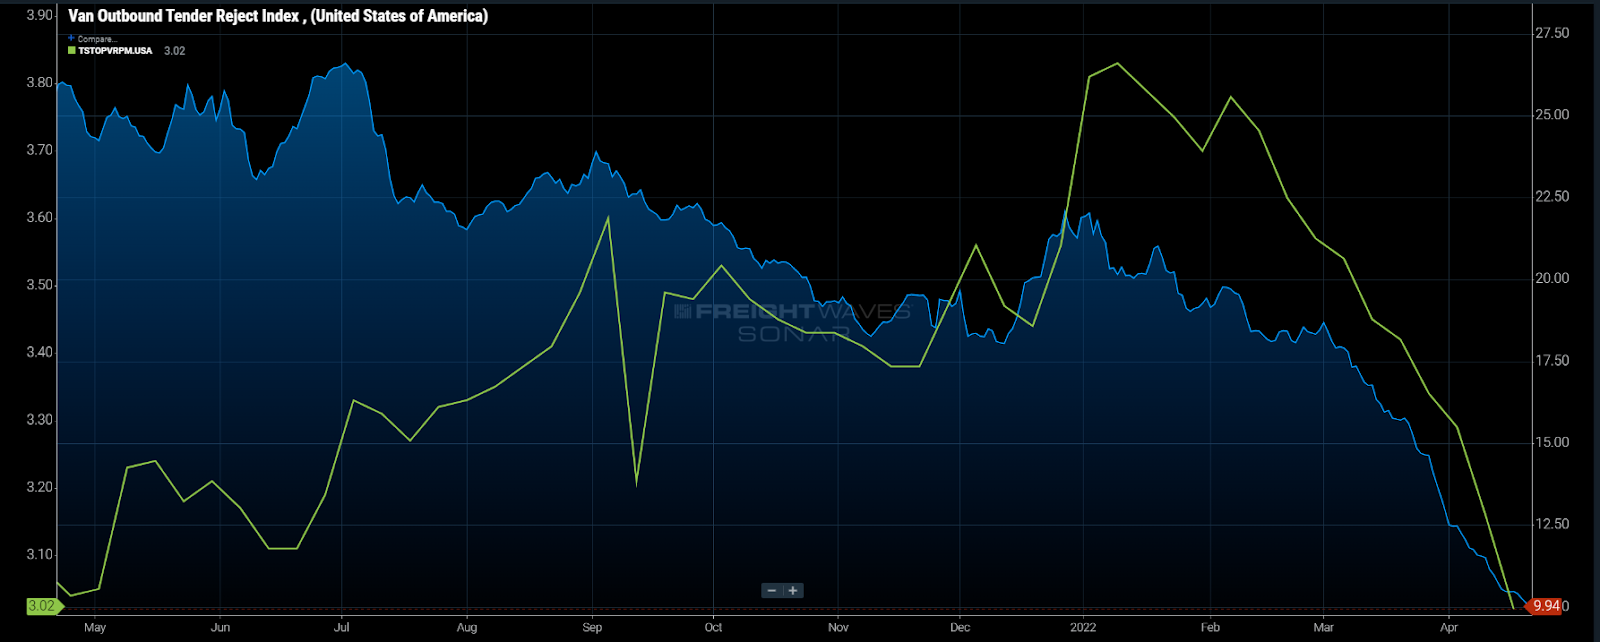
Chart of the Week: Vn Outbound Tender Volume Index, Truckstop.com 7-day van rate per mile – USA SONAR: VOTRI.USA, TSTOPVRPM.USA
After nearly 19 months of averaging above 20%, national rejection rates have fallen to their lowest levels since June 2020 — dry van rejection rates at 9.9% and falling as of Thursday. Spot rates have accelerated their declines over the past two weeks but have been falling for dry van and refrigerated loads since the first week of February. The truckload market is most definitely transitioning to a much looser state, but there are stages of freight market easing and we are only just now getting close to finishing the first one — contract compliance.
Spot rates have traditionally been the earliest aggregated signal for truckload capacity changes due to relatively high visibility. Rates are still somewhat slow in the way that the people who control them — carriers and brokers — have a desire to move them in a certain direction depending on their needs.
From a midsize to larger carrier perspective, they are focused on maintaining utilization first and then expanding their margin. Even then, it is not that straightforward. Calculated profit margins are more like margins for error as there are a number of unexpected things like traffic and detention that could impact the profitability of the load before it is delivered. Carriers offer to move loads below cost when they have no other options in an oversupplied area.
Most of the upward rate pressure of the past year and a half has arisen from the incoming offers of shippers and brokers who offer rates higher than the carrier may need. To that point, brokers and shippers do not know capacity is tight until they cannot secure a load or their contracted carriers stop accepting loads. This makes the tender rejection the first available clean signal to the market as there is no human adjustment or evaluation needed.
The tender acceptance/rejection is a single decision point instead of the multiple that are included in rates, making it much faster and cleaner. Looking at the chart, you can see tender rejection rates accelerating downward a week in front of the spot rate.
Many publications and companies have mentioned a growth in trucking during March, but this is only partially true. Reading between the lines, you have to look for a key term: contract.
The contracted freight market is the freight that moves under a predetermined consistent rate agreement that lasts for longer than a single day or transaction. Most of these agreements between carrier and shipper/3PL have been established in 12-month periods or longer.
This is what tender data is based on as it requires a preset rate that both parties have agreed to. Electronic tenders can only be accepted or declined and have no spot for which to submit a rate.
When the freight market eases, carriers start to accept more contracted loads and the spot market erodes. The time it takes for the market to settle depends on the starting tightness. Rejection rates for van freight fell from 19% at the start of March to 12.5% by month-end, meaning there was still a good portion of freight that potentially fell to the spot market.
Accepted tender volumes, the loads that move under contract, were up for the entire month of March. This means the erosion in freight demand had not hit the contracted volumes yet.
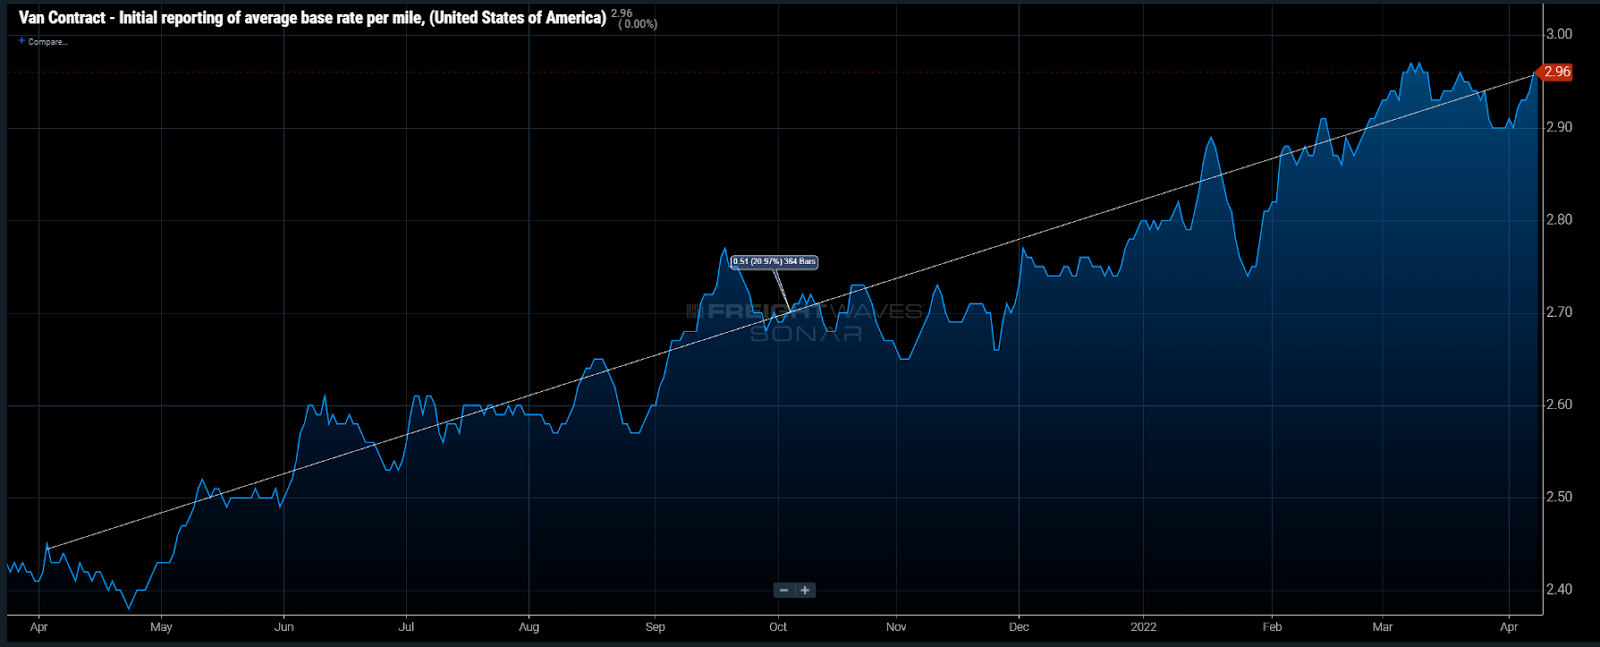
Contract rates (VCRPM1), not including fuel, have increased roughly 21% over the past year, according to FreightWaves’ $80 billion-plus database of invoice data, a figure well above the inflation rate. This means that carriers with a large percentage of contracted freight should have had a solid month from a year-over-year perspective.
The rejection rate indicates that carriers have simply covered more loads under long-term agreements as the market has settled. If volumes continue to decline, the spot market may become an area where shippers and brokers go to get discounts off the inflated contract prices instead of just a place to bid for capacity.
If this occurs, it will accelerate the cycle as both large and small carriers are forced to drop rates quickly. A freight recession is nearly a given considering the overheated nature of the market of the past 19 months, but the severity and length of it is still in question.
About the Chart of the Week
The FreightWaves Chart of the Week is a chart selection from SONAR that provides an interesting data point to describe the state of the freight markets. A chart is chosen from thousands of potential charts on SONAR to help participants visualize the freight market in real time. Each week a Market Expert will post a chart, along with commentary, live on the front page. After that, the Chart of the Week will be archived on FreightWaves.com for future reference.
SONAR aggregates data from hundreds of sources, presenting the data in charts and maps and providing commentary on what freight market experts want to know about the industry in real time.
The FreightWaves data science and product teams are releasing new datasets each week and enhancing the client experience.
To request a SONAR demo, click here.
Source: freightwaves - Truckload market only in early stages of easing
Editor: Zach Strickland, FW Market Expert & Market Analyst