Freight News:
Truckload market has 25% too much capacity
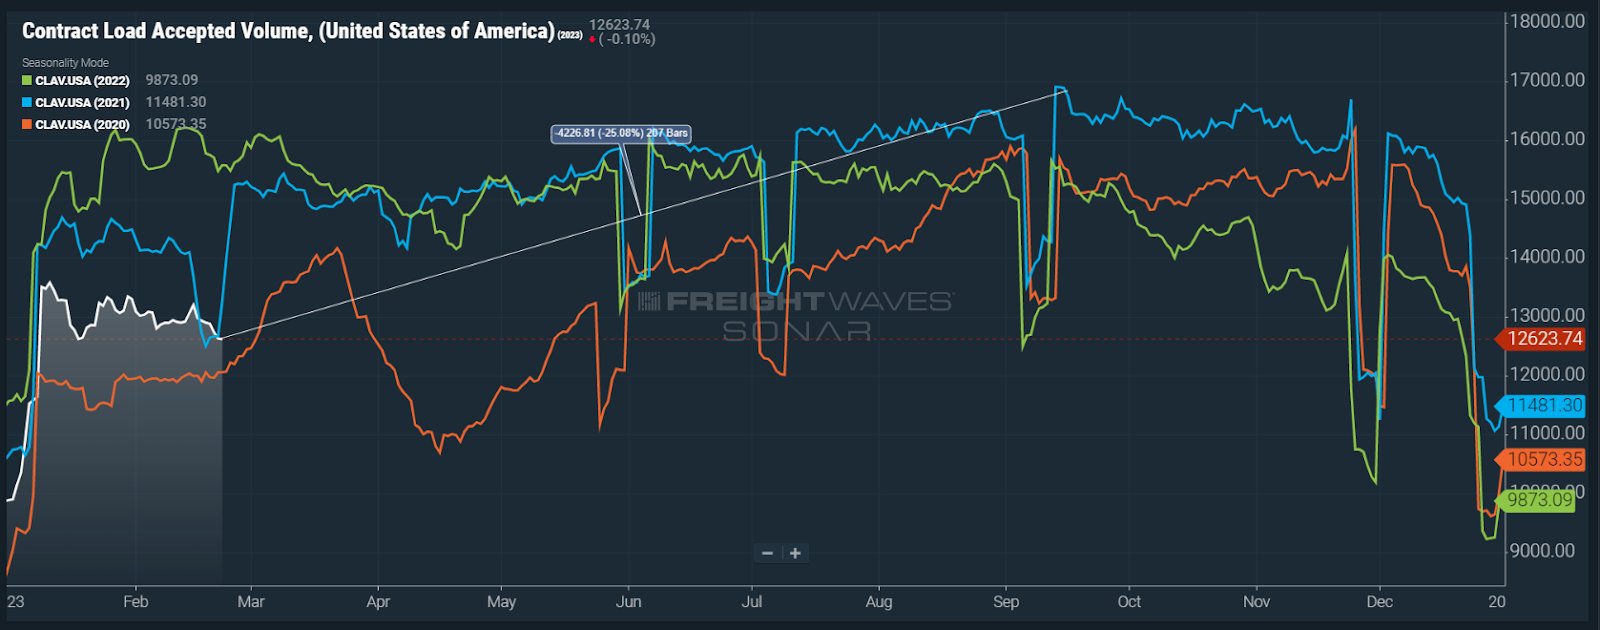
Chart of the Week: Contract Load Accepted Volume Index – USA SONAR: CLAV.USA
The Contract Load Accepted Volume Index (CLAV), which measures accepted truckload tender volumes, is 25% lower than the peak values in 2021. With rejected tenders being near historic highs at that point, we can assume this was the limit to the amount of volume carriers could handle.
Considering exits are just now starting to outpace entrants, according to recent Federal Motor Carrier Safety Administration data, 25% may be a smidge low after a year of new authorizations. How long will capacity take to be more in line with demand?
No demand
Even with demand remaining relatively unpredictable, there are no reasons to expect a significant stimulus event in the near future. The Fed is still fighting inflation with interest rate increases and has signaled that it has no reason to think its job is done.
The only macroeconomic indicators with any real strength in them have been the jobs market and revolving credit (credit card debt) dollar amounts, the latter of which being a negative sign for future consumption.
There are far more reasons to expect weakening demand rather than strengthening in 2023, which means trucking operators have to play a waiting game as to when some form of pricing leverage will return. That being said, freight demand is far more fickle than capacity shifts and needs to be monitored more closely even though there appears to be a significant buffer.
Capacity changes slowly
The supply side of the trucking transportation market is very slow to move, historically only changing around 1% per month. If we apply that rate forward, it will be 2025 before capacity and demand are in alignment.
The decision process to enter the market is a long one for an owner-operator. Many contemplate the move for years before pulling the trigger on purchasing a truck. Large fleets deliberate for months whether to expand their operations. Then it takes another nine months (longer during COVID) to receive the truck.
Because of the lengthy and costly process to expand capacity, the decision to exit or park trucks is also extended. This is a life-altering decision for an owner-operator and deliberation should not be quick. From a large fleet perspective, it is potentially missing growth opportunities if it misjudges the market — this is possibly worse than having too many trucks available for long-term viability.
Capacity does not have to contract completely for rates to rise
Consumption and demand do not have the same constraints. Truckload demand flexes up and down 5% regularly from month to month, even before COVID. From April to September 2020, the CLAV increased 48% out of the economy’s initial lockdown period.
Accepted tenders were up 15% year over year (y/y) by the end of August. This suggests the for-hire truckload market had about 15% excess capacity available at the beginning of the pandemic in what was a relatively soft environment for trucking.
Even with the decent capacity buffer, seasonal price fluctuations on the spot market and rejection rates were present in 2019 and early 2020. By these standards, we can estimate it will take approximately 10 months before the market has some seasonal behavior if capacity contraction is consistent (it won’t be). But this gives us a decent starting point.
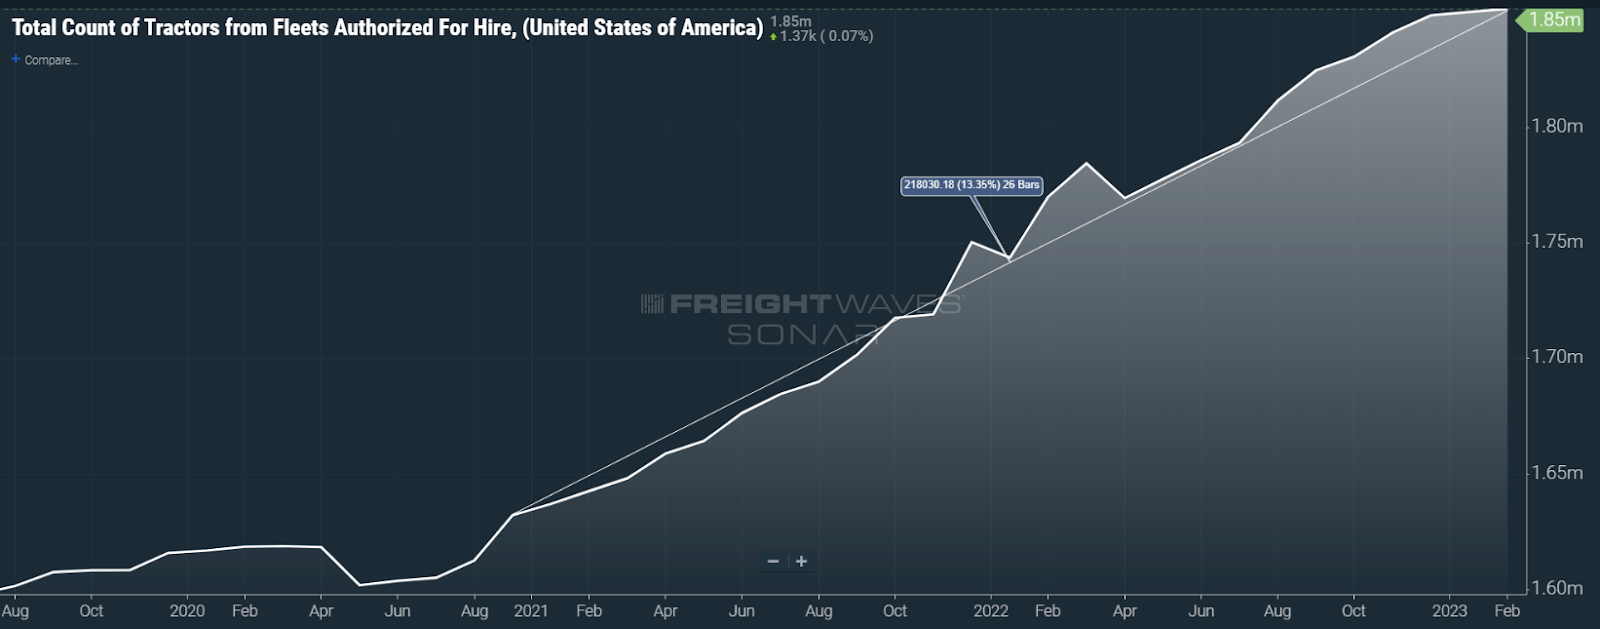
According to the FMCSA, active tractor count growth stalled last month and revocations are now outpacing new authorizations. This data is lagging and it is most likely safe to assume exits are outpacing the new entrants.
Large fleets are handling things differently. Covenant Transport decided to park 600 tractors in Q4 of 2022, leading to a rare y/y operating margin improvement for the sector in the quarter.
Many of the other publicly traded truckload companies posted equipment growth in 2022, but much of that came in the form of acquisitions. Werner added 200 trucks it acquired from the purchase of Baylor Trucking.
Consolidation is a form of capacity reduction in the way it diminishes competition.
How will we know?
Trucking capacity is extremely opaque and difficult to measure. It is also irrelevant without understanding demand. Just because there are enough trucks does not mean they are in the right place at the right time. Capacity needs to exceed demand for this reason.
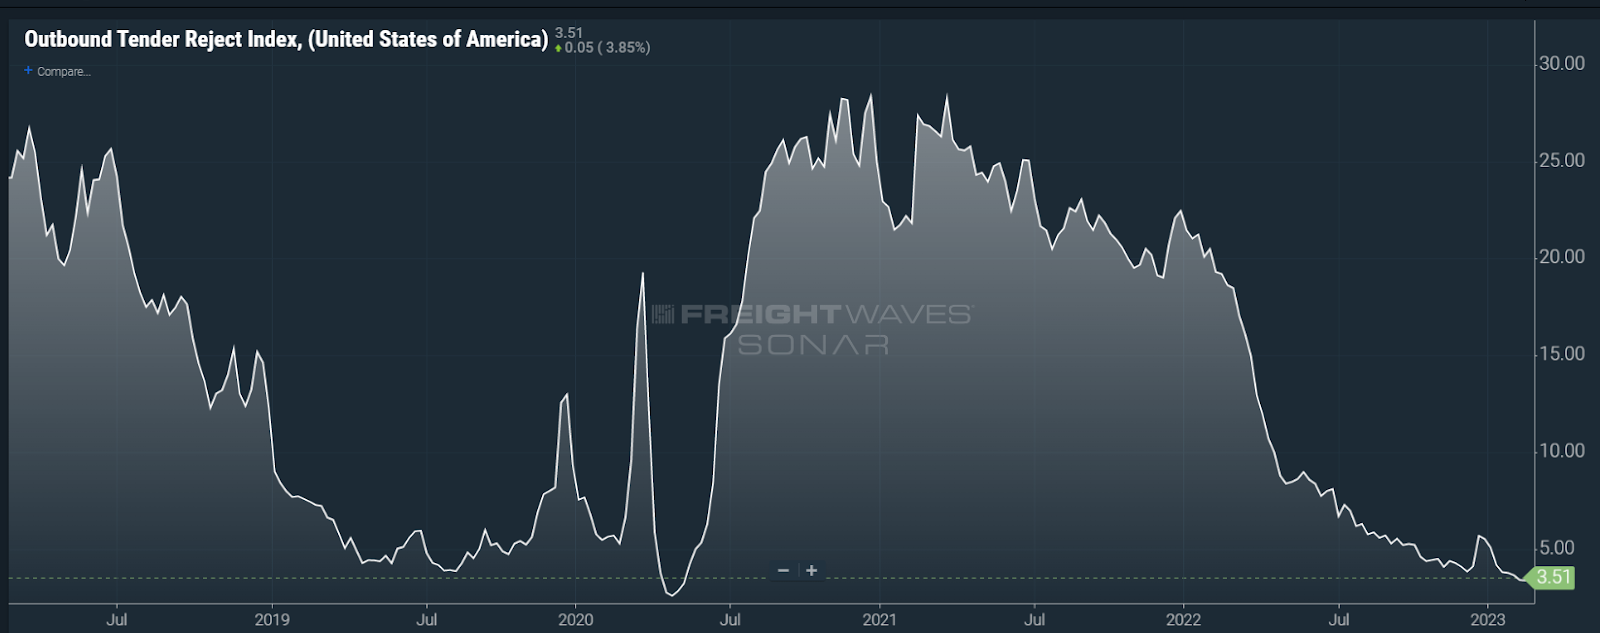
The first sign of capacity correction will be when tender rejections start to climb. Carriers rejecting capacity requests from contracted shippers is a measure of optionality or load availability. Rejection rates above 6% tend to be inflationary, while sub-6% rates correlate with static or deflationary rate conditions. As of now, the national Outbound Tender Rejection Index (OTRI) is hovering around 3.5%, indicating capacity is readily available in aggregate.
About the Chart of the Week
The FreightWaves Chart of the Week is a chart selection from SONAR that provides an interesting data point to describe the state of the freight markets. A chart is chosen from thousands of potential charts on SONAR to help participants visualize the freight market in real time. Each week a Market Expert will post a chart, along with commentary, live on the front page. After that, the Chart of the Week will be archived on FreightWaves.com for future reference.
SONAR aggregates data from hundreds of sources, presenting the data in charts and maps and providing commentary on what freight market experts want to know about the industry in real time.
The FreightWaves data science and product teams are releasing new datasets each week and enhancing the client experience.
To request a SONAR demo, click here.
The post Truckload market has 25% too much capacity appeared first on FreightWaves.
Source: freightwaves - Truckload market has 25% too much capacity
Editor: Zach Strickland, FW Market Expert & Market Analyst