Freight News:
The most wonderful time
This week’s FreightWaves Supply Chain Pricing Power Index: 35 (Shippers)
Last week’s FreightWaves Supply Chain Pricing Power Index: 35 (Shippers)
Three-month FreightWaves Supply Chain Pricing Power Index Outlook: 35 (Shippers)
The FreightWaves Supply Chain Pricing Power Index uses the analytics and data in FreightWaves SONAR to analyze the market and estimate the negotiating power for rates between shippers and carriers.
This week’s Pricing Power Index is based on the following indicators:
All’s well that ends well
Signals from the Outbound Tender Volume Index (OTVI) will be a bit erratic until next week, as the holiday noise from Thanksgiving is currently skewing volume levels. Since OTVI is calculated as a seven-day moving average, and since freight demand on Thanksgiving was effectively absent, the recent dip should not be alarming.
In fact, tender volumes were effortlessly outpacing 2022 levels in the run-up to the holiday and came within spitting distance of 2020 — the second-best year for freight demand on record. Yet volume trends as a whole will be largely insignificant during the remainder of the year, as December is a very soft month for demand. Instead, the direction of tender rejections and carrier rates will be the metrics to watch.
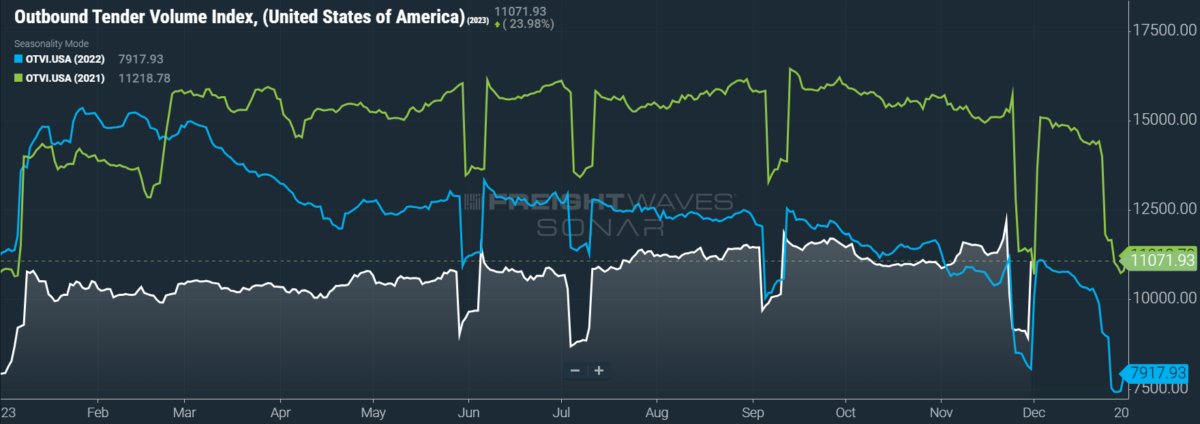
SONAR: OTVI.USA: 2023 (white), 2022 (blue) and 2021 (green)
To learn more about FreightWaves SONAR, click here.
OTVI, which measures national freight demand by shippers’ requests for capacity, fell an unsurprising 1.51% on a two-week basis as holiday noise devalues comps made against last week’s data. On a year-over-year (y/y) basis, OTVI is up 9.76%, though such y/y comparisons can be colored by significant shifts in tender rejections. OTVI, which includes both accepted and rejected tenders, can be inflated by an uptick in the Outbound Tender Reject Index (OTRI).
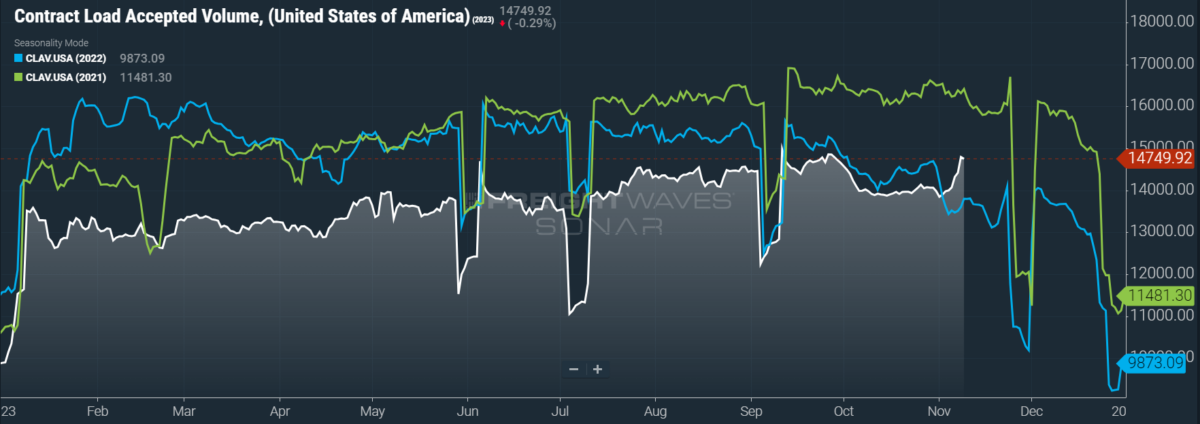
SONAR: CLAV.USA: 2023 (white), 2022 (blue) and 2021 (green)
To learn more about FreightWaves SONAR, click here.
Contract Load Accepted Volume is an index that measures accepted load volumes moving under contracted agreements. In short, it is similar to OTVI but without the rejected tenders. Looking at accepted tender volumes, we see a fall of 21% on a two-week basis and a rise of 10.44% y/y. This narrowing y/y difference implies that actual freight flow is recovering from this cycle’s bottom.
Bad news came from the goods economy in October, as personal consumption on goods fell 0.2% from the month prior, while durable goods spending fell 0.5% over the same period. These drops are disappointing because of the strength seen during September, when durable goods spending rose 1.1% on a monthly basis. That said, consumers continue to save at a relatively low rate (the personal savings rate edged up to 3.8% from 3.7% previously), which supports a picture of persistent consumption.
Recent data from Bank of America reveals a confidently strong start to the holiday shopping season. Consumer spending on holiday goods was up 4% y/y on Black Friday, a comp made even more remarkable by the fact that core goods inflation was flat y/y in October. In other words, growth in real spending and thus real consumer demand is comfortably higher than it was in 2022.
Looking ahead to the Federal Reserve’s next meeting in mid-December, it appears likely that the target federal funds rate will remain unchanged and that policy is at its tightest level for this cycle. Fed Gov. Christopher Waller recently stated that “something appears to be giving, and it’s the pace of the economy.” While rate cuts are not probable until late Q2 or early Q3 of next year, December’s meeting could herald a shift in the Fed’s attitude toward interest rates: namely, that its default bias pivots from hawkishness to dovishness. Easing interest rates will certainly help the consumer, which in turn provides a tailwind to the goods economy and truckload markets.
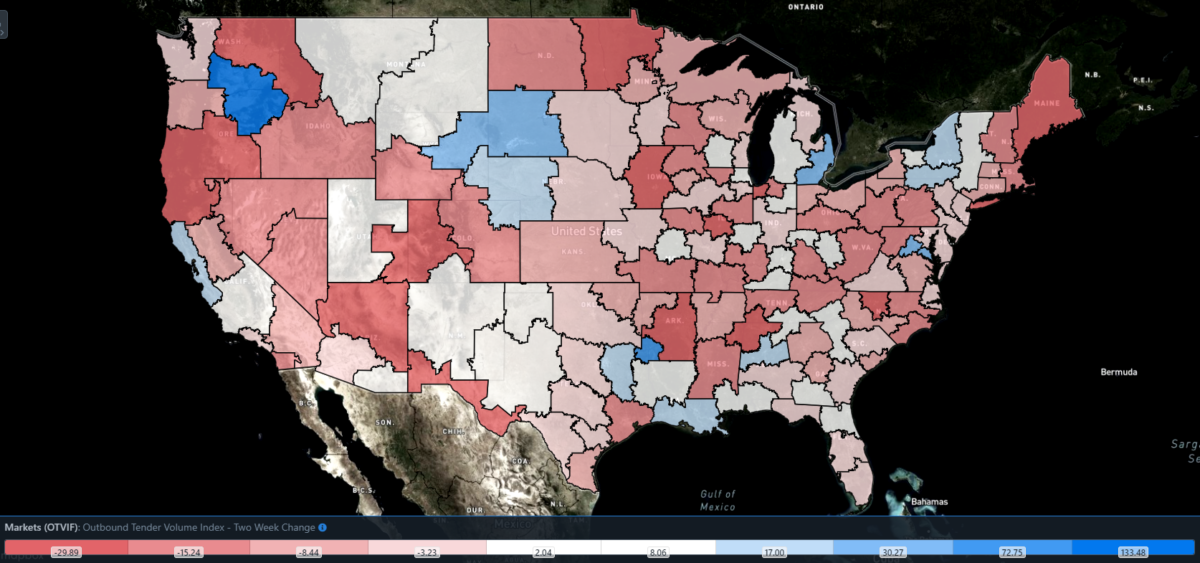
SONAR: Outbound Tender Volume Index – Two Week Change (OTVIF).
To learn more about FreightWaves SONAR, click here.
Of the 135 total markets, only 46 reported increases in tender volumes on a two-week basis, as the strongest performances were scattered across the country.
Gas, break, dip
After an appreciable bump around Thanksgiving — albeit one that failed to match the highs of 2022’s spike — tender rejection rates quickly began to slide at the end of the month. OTRI very well might be headed to early November’s low of 3.29%, which was its lowest reading since early August. If last year’s trends hold, OTRI will continue to decline until mid-December, at which point it should rise from holiday tightness.
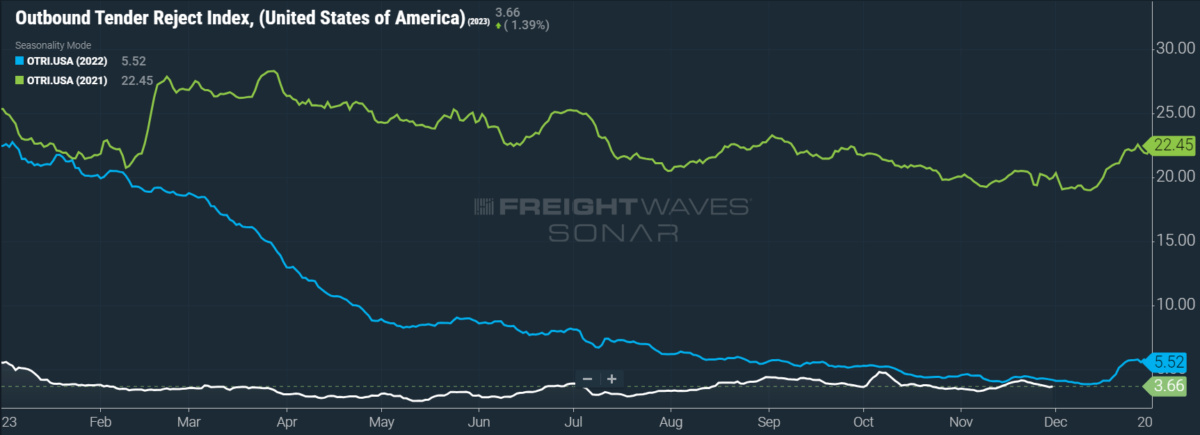
SONAR: OTRI.USA: 2023 (white), 2022 (blue) and 2021 (green)
To learn more about FreightWaves SONAR, click here.
Over the past week, OTRI, which measures relative capacity in the market, fell to 3.66%, a change of 30 basis points from the week prior. OTRI is now only 44 bps below year-ago levels.
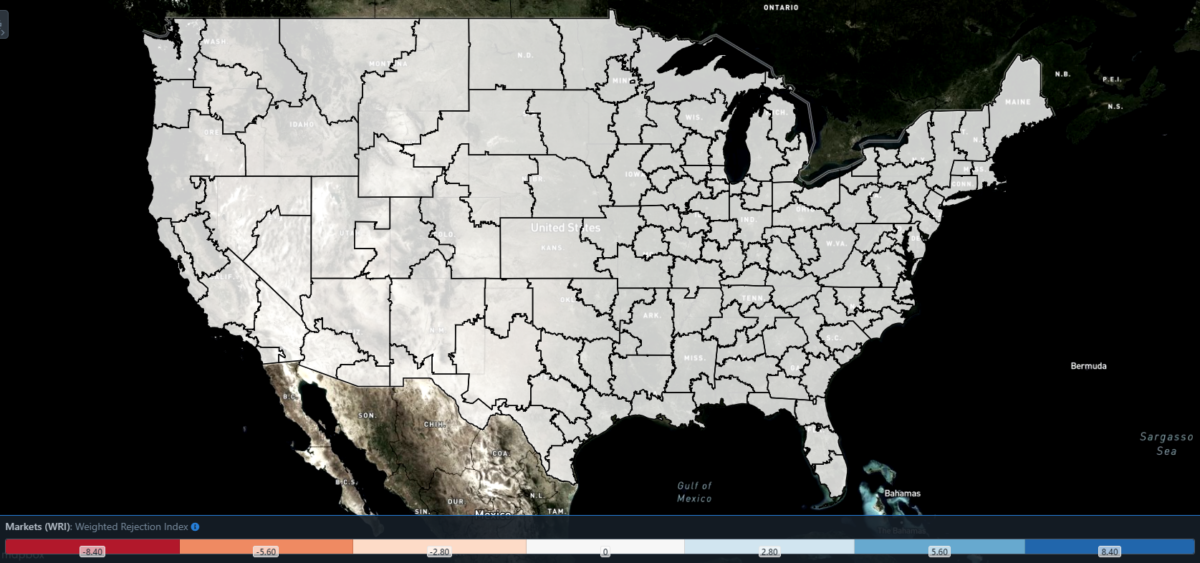
SONAR: WRI (color)
To learn more about FreightWaves SONAR, click here.
The map above shows the Weighted Rejection Index (WRI), the product of the Outbound Tender Reject Index – Weekly Change and Outbound Tender Market Share, as a way to prioritize rejection rate changes. As capacity is generally finding freight this week, no regions posted a blue market, which are usually the ones to focus on.
Of the 135 markets, 51 reported higher rejection rates over the past week, though 34 of those saw increases of only 100 or fewer bps.
Oil cartel stumbles after unforced errors
Oil markets had an unusual reaction to some unusual circumstances. Last week, OPEC’s meeting was delayed over disagreements among the member states as to the size and distribution of proposed cuts to production quotas. On Thursday, it was announced that OPEC+ had not changed its production targets for Q1 2024. Instead, individual members had agreed to voluntary cuts totaling roughly 2.2 million barrels per day. Of those known, Saudi Arabia agreed to extend its current 1 million bpd cut, while Russia agreed to deepen its cut from 300,000 to 500,000 bpd.
All else being equal, news of production cuts should goose oil prices and therefore prices of distillate fuels like diesel. But the chaotic nature of OPEC’s announcements betrayed a potential disunity at the heart of the cartel, leaving oil markets with little confidence that the group could meaningfully influence prices. As such, domestic oil prices slid further from late September’s peak of $94 per barrel, currently trending at $76 per barrel. Retail diesel prices similarly gained some distance from September’s high of $4.61 per gallon, starting December at a national average of $4.25 per gallon.
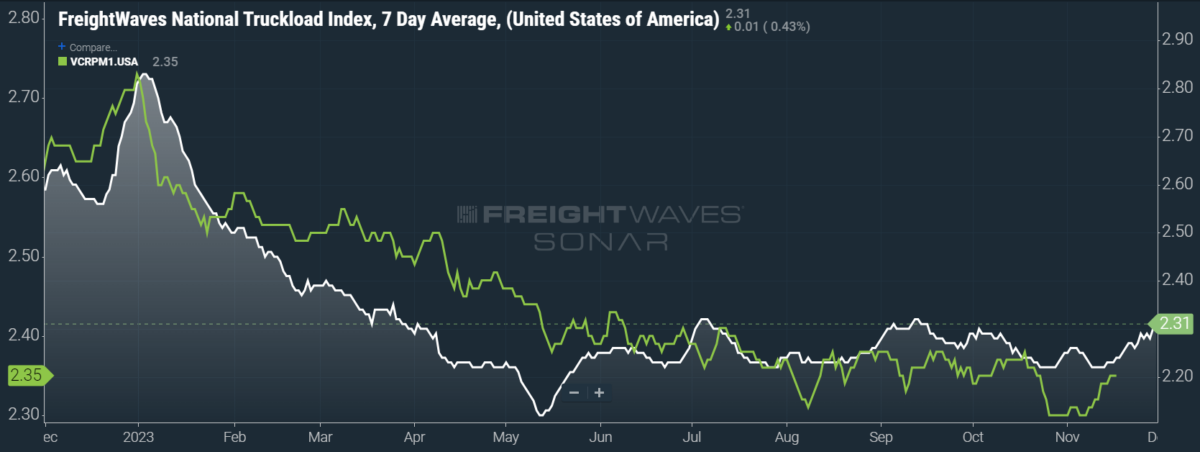
SONAR: National Truckload Index, 7-day average (white; right axis) and dry van contract rate (green; left axis).
To learn more about FreightWaves SONAR, click here.
This week, the National Truckload Index (NTI) — which includes fuel surcharges and other accessorials — rose 5 cents per mile to $2.31. Falling fuel prices could not undo the gains in linehaul rates, as the linehaul variant of the NTI (NTIL) — which excludes fuel surcharges and other accessorials — rose 6 cents per mile w/w to $1.66.
Contract rates, which are reported on a two-week delay, are still shaking off a brutal dip from late October and early November. But while those losses have largely been reversed, contract rates are still trending a few cents lower than their Q3 average. Bid season will continue over the next few months, and so the ultimate floor for contract rates has yet to be found. For the time being, contract rates — which exclude fuel surcharges and other accessorials like the NTIL — are up 3 cents per mile w/w to $2.35.
To learn more about FreightWaves SONAR, click here.
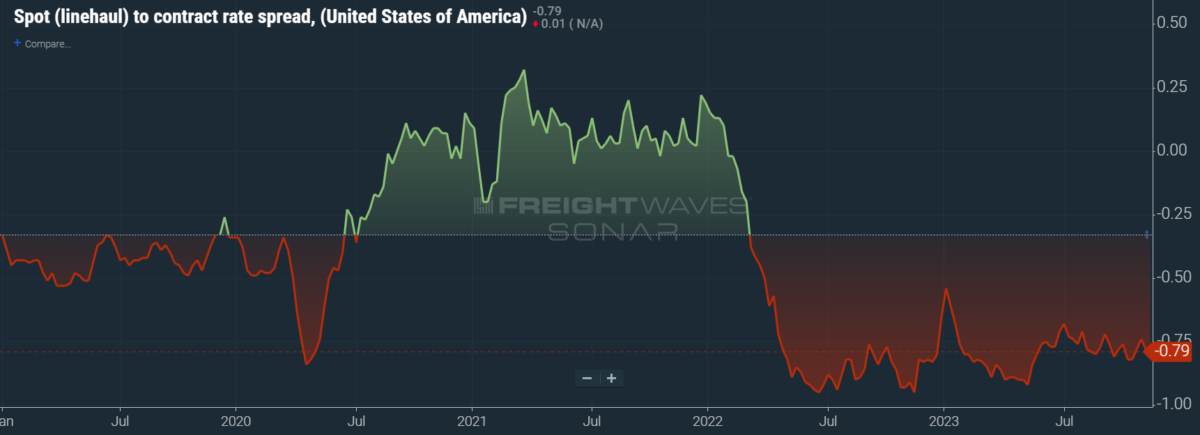
The chart above shows the spread between the NTIL and dry van contract rates, revealing the index has fallen to all-time lows in the data set, which dates to early 2019. Throughout that year, contract rates exceeded spot rates, leading to a record number of bankruptcies in the space. Once COVID-19 spread, spot rates reacted quickly, rising to record highs seemingly weekly, while contract rates slowly crept higher throughout 2021.
Despite this spread narrowing significantly early in the year, tightening by 20 cents per mile in January, it has remained wide throughout most of the year to date. As linehaul spot rates remain 79 cents below contract rates, there is plenty of room for contract rates to decline — or for spot rates to rise — in the final month of the year.
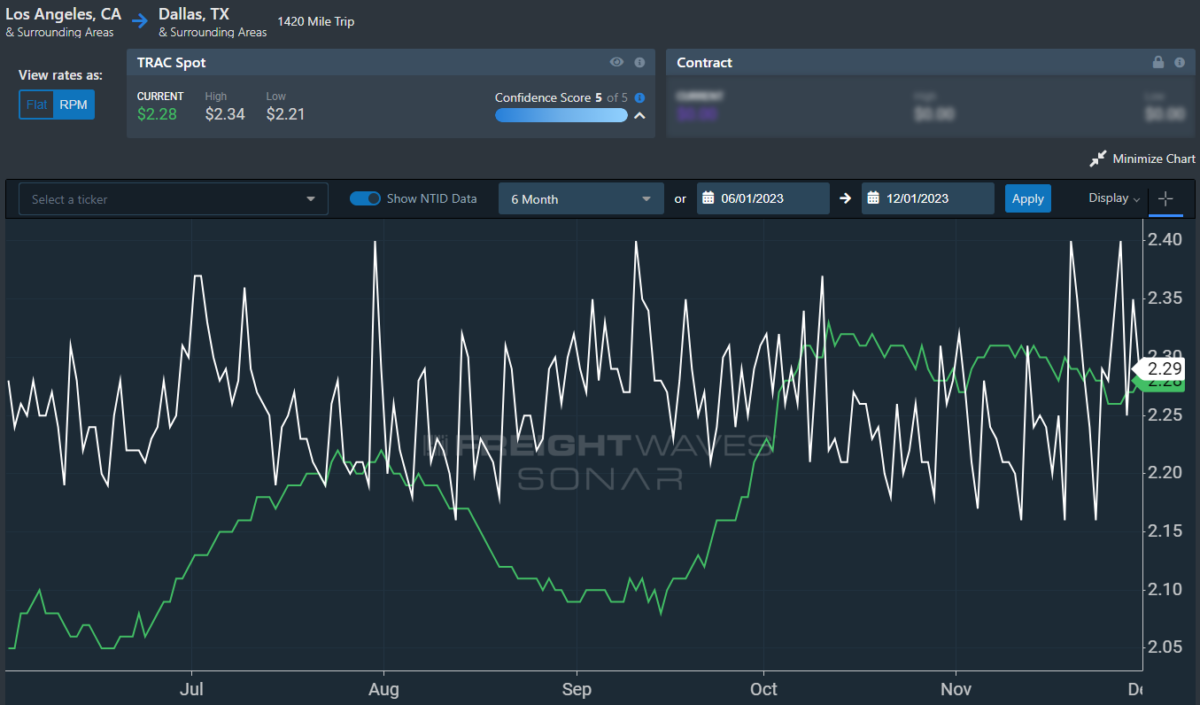
To learn more about FreightWaves TRAC, click here.
The FreightWaves Trusted Rate Assessment Consortium (TRAC) spot rate from Los Angeles to Dallas, arguably one of the densest freight lanes in the country, is still recovering from a recent dip. Over the past week, the TRAC rate remained unchanged w/w at $2.28 — lingering near its year-to-date high of $2.39. The daily NTI (NTID), which has risen to $2.29, is again outpacing rates along this lane.
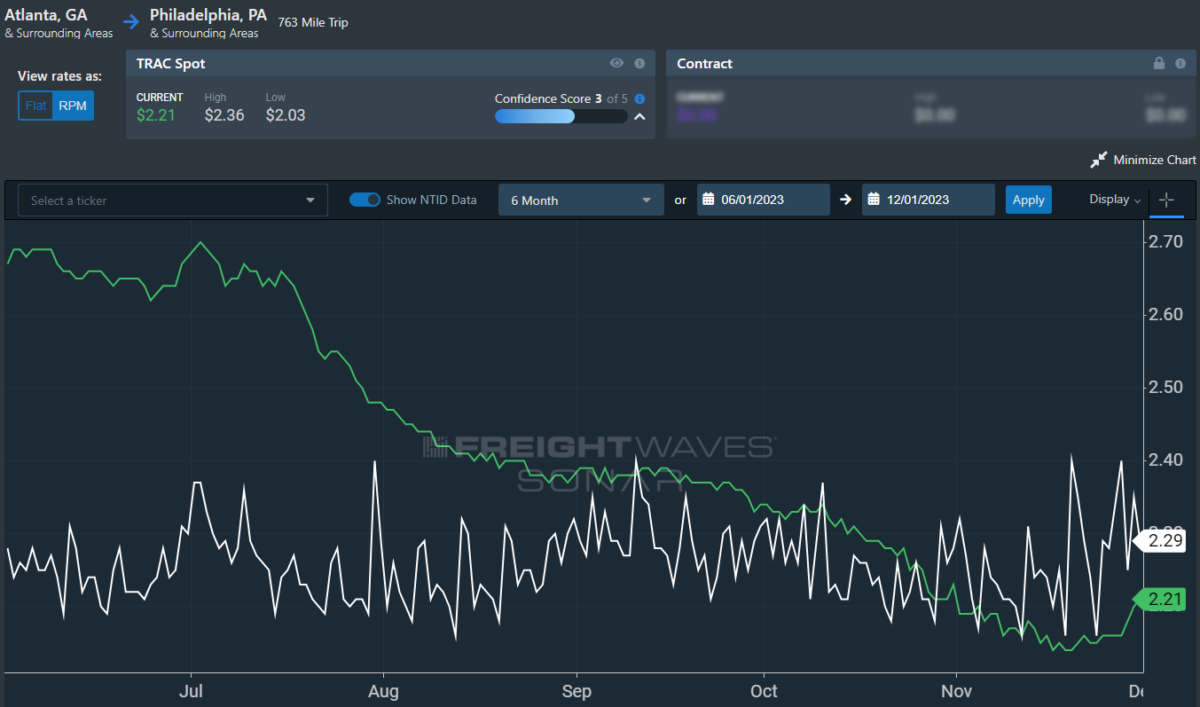
To learn more about FreightWaves TRAC, click here.
On the East Coast, especially out of Atlanta, rates saw a stark reversal of November’s losses but are still well below their Q3 average. The FreightWaves TRAC rate from Atlanta to Philadelphia shot up 6 cents per mile to $2.21. After plateauing well above the national average during the summer, rates along this lane declined sharply at the end of July, lacking any positive momentum until recently.
For more information on FreightWaves’ research, please contact Michael Rudolph at mrudolph@freightwaves.com or Tony Mulvey at tmulvey@freightwaves.com.
The post The most wonderful time appeared first on FreightWaves.
Source: freightwaves - The most wonderful time
Editor: Michael Rudolph