Freight News:
Tanker shipping takes another hit from Saudi, Russian crude cuts
The history of ocean shipping is replete with predictions for booms that never came to pass. There are also many cases in which major turns in shipping cycles were predicted and actually happened, but not on cue.
This was supposed to be the year the next tanker shipping supercycle began. Over eight months in, the boom remains hypothetical. Rates for some tankers are flirting with breakeven again. Near-term negatives continue to pile up. Revenues from spot deals booked at today’s weak rates will pressure fourth-quarter results.
Time to reschedule the upswing for 2024.
“While Q4 crude-tanker earnings will likely be softer than expected, the outlook for 2024 has become much more exciting,” wrote Jefferies analyst Omar Nokta in a client note on Wednesday. The expected upswing has merely been “deferred and strengthened.”
According to Clarksons Securities analyst Frode Mørkedal, “When OPEC+ eventually resumes production, which is projected to happen in earnest by Q2 2024, the tanker market should experience an immediate uplift.” (OPEC+ comprises OPEC nations, Russia and other countries.)
Nokta said he is “increasingly confident that 2024 will be a banner year for tankers,” with the market poised for a “rate eruption” next year.
Near-term negatives from Saudi Arabia, Russia
On Tuesday, Saudi Arabia extended its voluntary 1-million-barrel-per-day (b/d) cut through year-end, on top of existing OPEC+ cuts. Russia extended its own 500,000-b/d crude-production cut in August with a 300,000-b/d reduction from September through December.
Saudi cuts are particularly damaging to demand for very large crude carriers (VLCCs; tankers that carry 2 million barrels of crude) that do high-volume, long-haul runs.
The evolving situation for Russian exports is negative for the tankers that fit in Russian ports: Suezmaxes (1 million-barrel capacity) and Aframaxes (750,000-barrel capacity).
According to data from Kpler, Russia exported 3.12 million b/d of seaborne crude in August, down 18% from the recent high in May. Russian seaborne products exports averaged 1.58 million b/d last month, down 22% from the recent high in March.

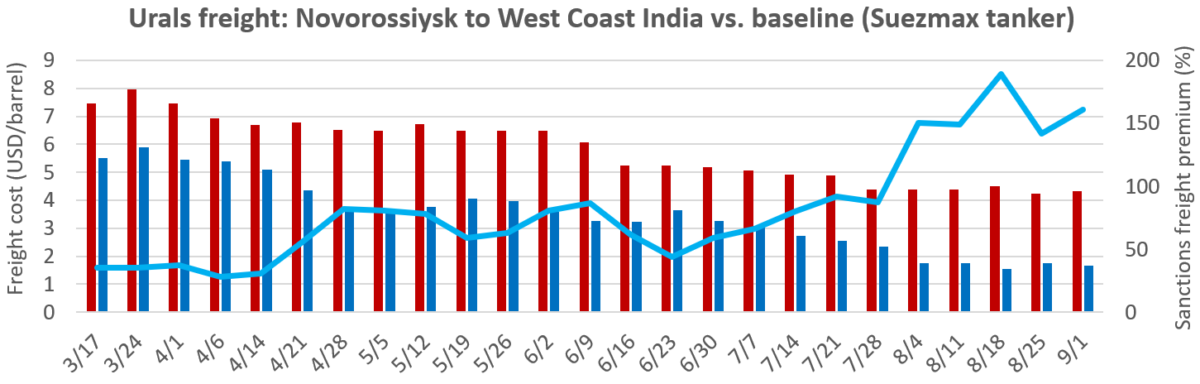
Russian Urals crude shipped from Black Sea and Baltic Sea ports has traded above the $60-per-barrel price cap set by Group of Seven nations and the European Union since mid-July. Prices are no longer even close to the cap. Urals crude was at $77 per barrel on Tuesday, according to price-reporting agency Argus.

“The sharp [price] increase was a result of Russia for the most part fulfilling its pledge to cut its overall crude exports by 500,000 b/d in August, with Urals taking the brunt of this reduction,” Kuganiga Kuganeswaran, Argus’ head of Russian crude pricing, told FreightWaves.
Tanker migration from Russian trade
The extended breach of the price cap has pushed most traditional European tanker owners out of the Russian trade and brought them back into non-sanctioned Suezmax and Aframax markets, adding capacity to non-sanctioned trades.
Data from Argus shows that this tonnage migration pushed down rates in non-sanctioned trades after the price cap was breached, while Russian freight rates have remained largely flat, inflating the “sanctions premium” for vessels willing to load Russian crude over the price cap — i.e., the so-called “shadow tanker” fleet.
The higher price of Russian Urals crude has also led one of its two main customers — India — to curb its purchases. (The other buyer, China, has maintained import volumes from Russia.)
India has increasingly turned to the Middle East, requiring much shorter tanker voyages, a negative for tanker demand measured in ton-miles (volume multiplied by distance).
Russian crude accounted for 45% of India’s crude imports in May, according to Kpler data. By August, Russia’s share had tumbled to 34%. India imported 1.48 million b/d of Russian crude last month, down 30% from a high of 2.12 million b/d in May.

Crude tanker rates sinking
Crude tanker rates have now fallen well below rates for product tankers — vessels that carry cargoes such as diesel, gasoline and jet fuel.
Spot rates for non-eco-design VLCCs averaged just $17,900 per day on Wednesday, down 47% month on month (m/m), according to Clarksons Securities.
There are “new lows across the board this week as the market reflects the new norm of lower OPEC volume,” said brokerage Fearnleys on Wednesday, referring to VLCC rates. Non-eco VLCCs are just “a few thousand above OPEX [operating expense breakeven],” while VLCCs without fuel-cost-saving exhaust-gas scrubbers “are almost on it,” said Fearnleys.
VLCC rates are not only lower than product tanker rates, they’re lower than rates for smaller-size crude carriers.
Rates for non-eco Suezmax crude carriers were down to $26,100 per day on Wednesday, declining 31% m/m. Aframax rates were $19,200 per day, down 20% m/m.
Historical data from Clarksons shows that VLCC and Aframaxes have fallen back to the trailing five-year average (a period that included one of the worst tanker markets in history).

Product tanker rates holding up
“Spot rates are moving in different directions,” said Nokta. Crude tanker rates are falling but product tanker rates are “doing just fine.”
Data from Clarksons shows that spot rates for the three main classes of product tankers have trended up since July and are all above their five-year average, with medium-range (MR) tankers almost double that average.

“Crack spreads [refiner margins] remain strong globally, and are holding on to most gains made since June,” Nokta wrote. “This has boosted refinery throughput, leading to increased product cargo availability and higher product-tanker demand.”
Nokta cut his Q4 crude-tanker rate outlook on Wednesday in the wake of the OPEC+ news, but he kept his Q4 product-tanker rate forecast unchanged.
Click for more articles by Greg Miller
Related articles:
- Sanctions on Russian crude and diesel exports are failing
- Russian crude prices have breached the G-7 price cap. Now what?
- How could sooner-than-expected Russian defeat impact shipping?
- Profiting from sanctions: Shipping premiums surge for Russian oil
- One year later: How Ukraine-Russia war reshaped ocean shipping
- China-Russia vs. US-EU: How global shipping is slowly splitting in two
- Price cap on Russian crude could soon face its biggest test
- European tanker owners make a fortune off Russian oil trade
- Welcome to the dark side: The rise of tanker shipping’s ‘shadow fleet’
- Could Russia sanctions work in practice even if they fail on paper?
The post Tanker shipping takes another hit from Saudi, Russian crude cuts appeared first on FreightWaves.
Source: freightwaves - Tanker shipping takes another hit from Saudi, Russian crude cuts
Editor: Greg Miller