Freight News:
Supply chain index hits new low; some green shoots noted
Supply chain activity hit a new low in June, according to data collected in the Logistics Managers’ Index (LMI). A Wednesday report showed the LMI stood at 45.6 in the month, 1.7 percentage points lower than in May and a fourth straight record low for the data set.
A reading below 50 indicates contraction while one above 50 signals expansion. The LMI is a survey of supply chain professionals.
Transportation prices (32.8) fell at a slower pace during the month but remained well into contraction territory as capacity (71.2) has been in growth mode since April of last year.
“Despite the excess capacity and low prices, the exits from the freight market that we would have expected to see have not yet materialized,” the report said.
Transportation utilization (46.8) was up slightly from May but remained in contraction for a second straight month.
The index’s one-year outlook for transportation prices was 59.1, the highest of 2023 and 11.6 points higher than the May expectation. The responses from survey participants indicates the group expects “a rebalancing of the freight market over the next 12 months.”
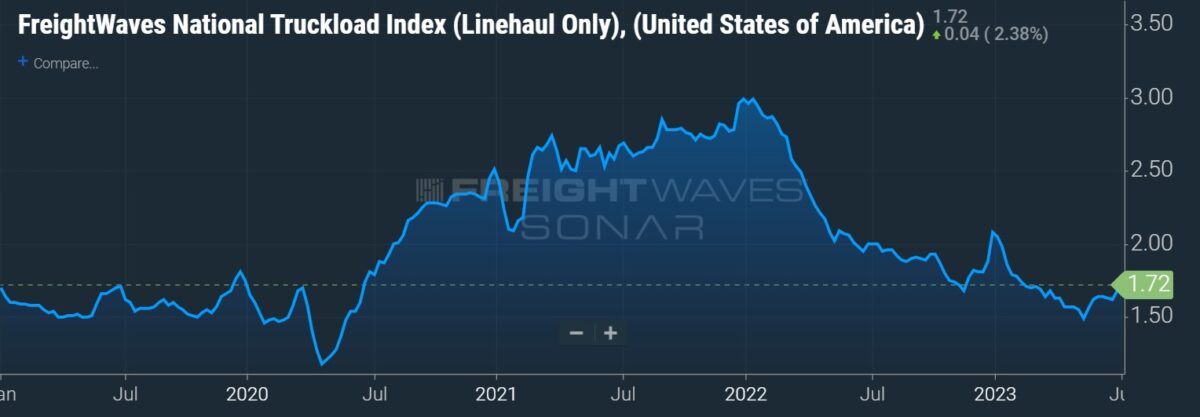
FreightWaves’ spot rate truckload data has inflected positively in recent weeks. However, the data set remains depressed from early 2022 highs as freight volumes have receded, shippers continue to purge inventories and small carriers hang around longer than expected.
The report showed inventory levels (42.9) declined 6.6 points during the month, the second-fastest pace of decline for the nearly 7-year-old index.
“Seasonality would suggest that this value should come up soon, but there are some signals that that might not happen,” the report read, pointing to softness in Chinese production ahead of the back-to-school shopping season.
Inventory costs (57.1) grew at a slower pace in the month as warehousing capacity (63.5) surged 6.8 points and grew at the fastest pace the index has ever recorded. Respondents’ view of warehouse capacity was 22.5 points higher than in the same month of 2022. Wholesalers and manufacturers viewed the real estate market much looser than downstream retailers did.
Warehouse utilization (56.8) continued to expand as “some firms are clearly betting that a move back towards season spending on goods and an increase in ecommerce will lead to more demand down the road.”
Warehousing prices (63.3) continued to grow but at a more modest pace. However, the prior-year comparisons are high as the subindex has been above 60 for 39 straight months.
The overall LMI reading for the next 12 months was up 5.8 points to 55.4, with all components of the index returning expansionary outlooks.
“Essentially, respondents believe that the future outlook is sunny, if somewhat muted compared to the wild swings we have seen from 2020-2023,” the report said. “This regression back towards the mean is consistent with what we observe in imports and overall business inventories. Whether this will also require significant freight capacity leaving the market remains to be seen.”
The LMI is a collaboration among Arizona State University, Colorado State University, Florida Atlantic University, Rutgers University and the University of Nevada, Reno, conducted in conjunction with the Council of Supply Chain Management Professionals.
More FreightWaves articles by Todd Maiden
- Knight-Swift lowers Q2 expectations, closes on U.S. Xpress deal
- Teamsters at ABF Freight ratify new labor deal
- Yellow calls on White House to get Teamsters to table
The post Supply chain index hits new low; some green shoots noted appeared first on FreightWaves.
Source: freightwaves - Supply chain index hits new low; some green shoots noted
Editor: Todd Maiden