Freight News:
Seasonal depression
This week’s FreightWaves Supply Chain Pricing Power Index: 35 (Shippers)
Last week’s FreightWaves Supply Chain Pricing Power Index: 35 (Shippers)
Three-month FreightWaves Supply Chain Pricing Power Index Outlook: 35 (Shippers)
The FreightWaves Supply Chain Pricing Power Index uses the analytics and data in FreightWaves SONAR to analyze the market and estimate the negotiating power for rates between shippers and carriers.
This week’s Pricing Power Index is based on the following indicators:
Keep the champagne corked
Freight demand is settling deeper into a seasonal slide at the close of October. While not by itself indicative of a failed recovery, this downward trend is doubtlessly painful for those carriers and brokerages still skirting the razor’s edge with thinning margins. Unfortunately, as will be discussed below, there is not much hope for a resurgence in freight volumes in the remainder of this year.
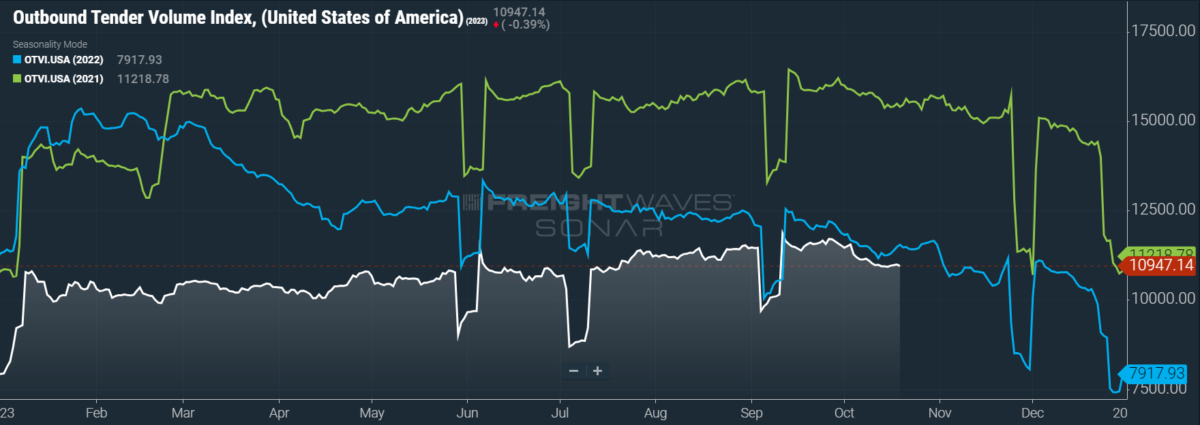
SONAR: OTVI.USA: 2023 (white), 2022 (blue) and 2021 (green)
To learn more about FreightWaves SONAR, click here.
This week, the Outbound Tender Volume Index (OTVI), which measures national freight demand by shippers’ requests for capacity, fell 0.3% week over week (w/w). On a year-over-year (y/y) basis, OTVI is down 4.56%, though such y/y comparisons can be colored by significant shifts in tender rejections. OTVI, which includes both accepted and rejected tenders, can be inflated by an uptick in the Outbound Tender Reject Index (OTRI).
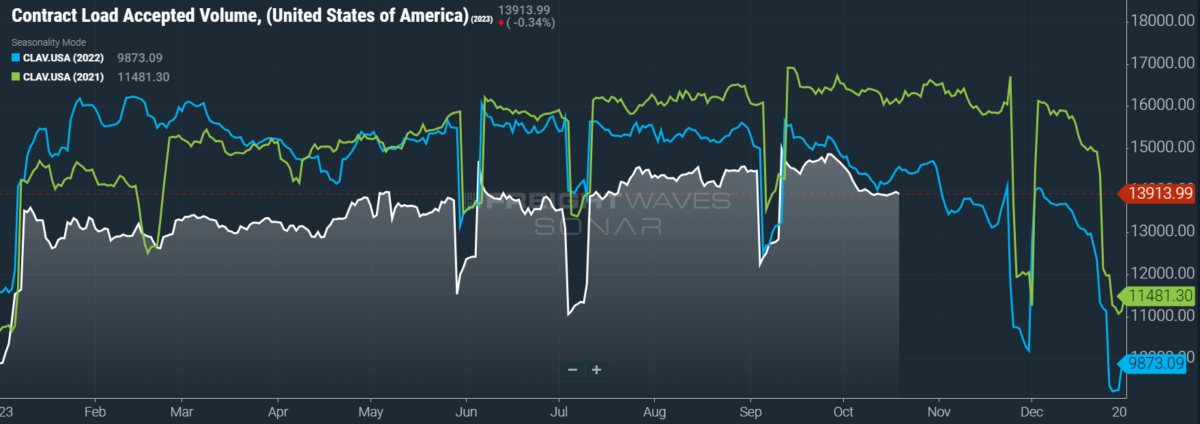
SONAR: CLAV.USA: 2023 (white), 2022 (blue) and 2021 (green)
To learn more about FreightWaves SONAR, click here.
Contract Load Accepted Volume (CLAV) is an index that measures accepted load volumes moving under contracted agreements. In short, it is similar to OTVI but without the rejected tenders. Looking at accepted tender volumes, we see a rise of 0.54% w/w as well as a fall of 3.57% y/y. This narrowing y/y difference implies that actual freight flow is still recovering from this cycle’s bottom.
As this column tends to focus on over-the-road truckload markets, one topic that is not frequently discussed here is maritime demand. Yet it should not be concluded that the ocean market is irrelevant to truckers — far from it, as imports accounted for the bulk of truckload volumes in the 2020-2021 freight market boom. Of course, one key supplier of U.S. maritime imports is China, though the country will see its place diminish in the coming years as re- and nearshoring efforts finally bear fruit.
Until then, however, China is the trade partner to watch. In the first week of October, China halted or significantly slowed operations in its manufacturing and distribution hubs during the country’s celebration of Golden Week. From Sept. 26 to Oct. 6, bookings to the U.S. from all ports — not just China’s — tumbled by more than 37% before recovering from the holiday. Bear in mind that these bookings preceded the vessel’s actual date of departure by roughly nine days, that transit times to the U.S. averaged over 27 days and that delays at either the shipping or receiving ports averaged a little under four days.
Barring any congestion at the ports of discharge, the above numbers imply that Golden Week’s disruption to the flow of U.S. imports will not be truly felt until 40 or more days — approximately six weeks — after the holiday. Assuming little delay with U.S. customs (a dangerous assumption if ever there was one), this 40-day lag leaves those imports with less than a week to move before Thanksgiving Day. In the period between Thanksgiving and Christmas, truckload volumes are sluggish at best. While carriers can gain pricing power here, since last-minute holiday shipments typically command a premium rate, it is not guaranteed: In 2022, spot rates from October’s peak to December’s rose by only 3.7%. In short, the bulk of the recovery will likely be delayed to Q2 2024 at the earliest.
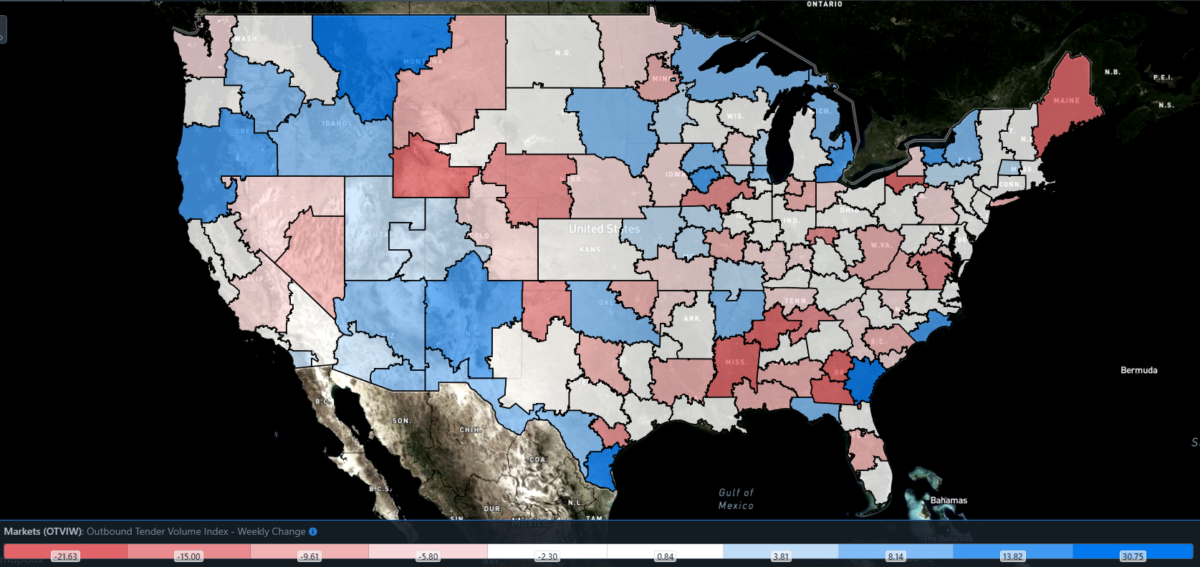
SONAR: Outbound Tender Volume Index – Weekly Change (OTVIW).
To learn more about FreightWaves SONAR, click here.
Of the 135 total markets, 64 reported weekly increases in tender volumes, though the hottest markets were small and scattered along the U.S.-Mexico border.
Falling elevators
Rejection rates have fallen far from their brief rally at the start of October. Outside of the aforementioned holiday rush periods, the fundamental lack of freight demand will continue to expose the lingering overcapacity in the market. This capacity will be bled out more slowly than in previous cycles, thanks in large part to the intervention of freight brokerages. This trend is a double-edged sword: On the one hand, a small number of tenacious carriers would benefit from supply and demand coming into balance sooner rather than later. On the other hand, this level of subsistence could keep overleveraged carriers around long enough to profit from the next boom.
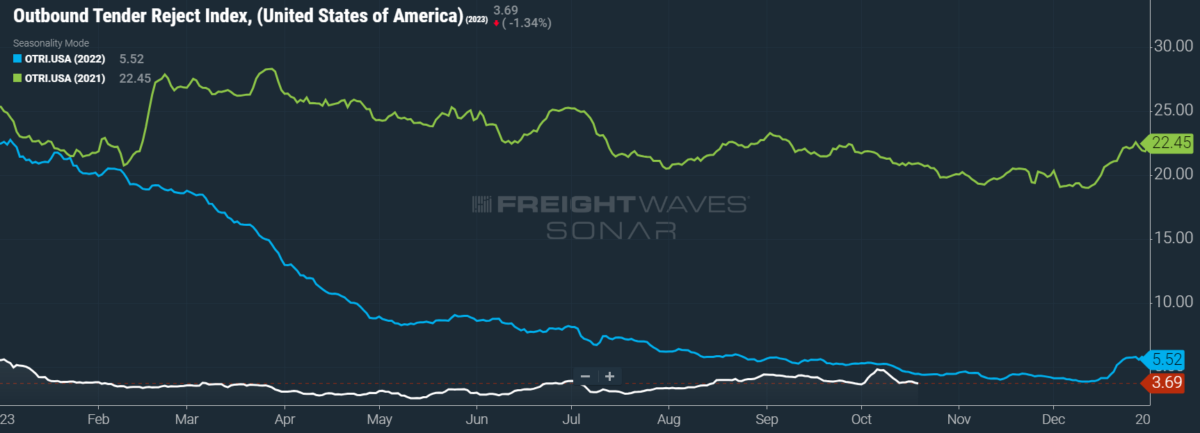
SONAR: OTRI.USA: 2023 (white), 2022 (blue) and 2021 (green)
To learn more about FreightWaves SONAR, click here.
Over the past week, OTRI, which measures relative capacity in the market, fell to 3.69%, a change of 25 basis points from the week prior. OTRI is now 76 bps below year-ago levels, with y/y comparisons becoming more favorable even if OTRI just remains stable.
Subsistence-level trucking is being jeopardized by the potential collapse of freight brokerages, which face their biggest challenges when contract rates lag painfully behind a recovering market — in other words, when the spread between spot and contract rates narrows. The largest domino to fall this week was Convoy, a digital freight brokerage that shuttered within a 48-hour window. The first warning was given with little advance notice on Wednesday, when all of Convoy’s shipments were abruptly canceled and its load board unceremoniously emptied. Yet it was not the industry’s only departure this week, as Certified Freight Logistics — a 95-year-old carrier and brokerage — announced that it would cease operating on Saturday.
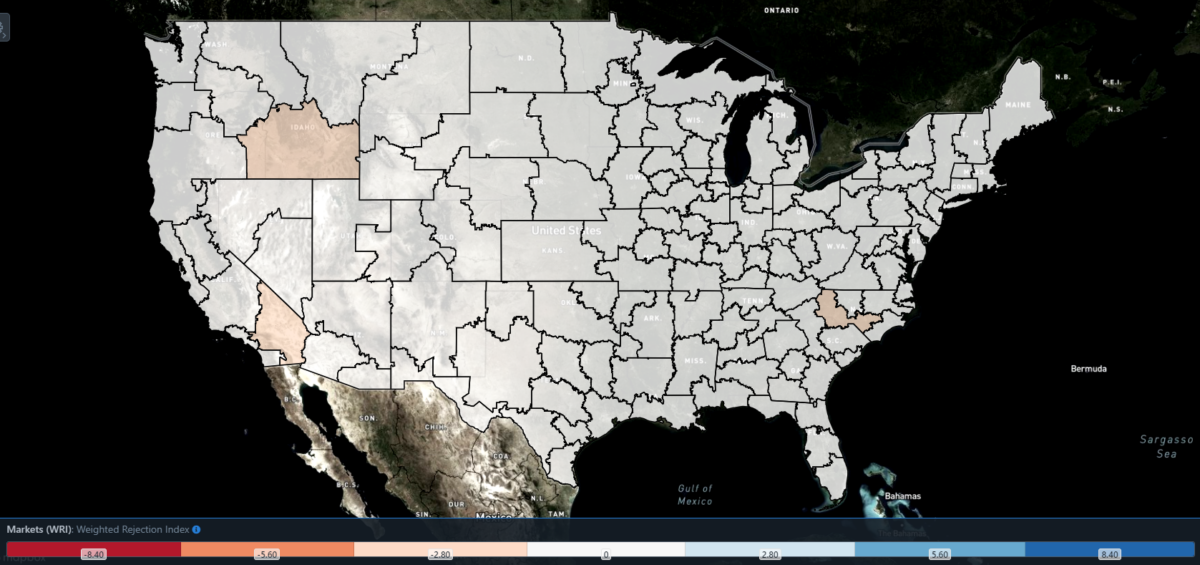
SONAR: WRI (color)
To learn more about FreightWaves SONAR, click here.
The map above shows the Weighted Rejection Index (WRI), the product of the Outbound Tender Reject Index – Weekly Change and Outbound Tender Market Share, as a way to prioritize rejection rate changes. As capacity is generally finding freight this week, no regions posted blue markets, which are usually the ones to focus on.
Of the 135 markets, 53 reported higher rejection rates over the past week, though 37 of those saw increases of only 100 or fewer bps.
Squeezing every last drop
Adding to the list of carrier woes is the recent collapse of the spread between retail and wholesale diesel prices, which nearly halved in just two weeks. This spread is significant for those carriers (typically large, enterprise fleets) that purchase diesel at cheaper wholesale prices and charge shippers — whether directly through contract agreements or indirectly through higher all-in rates — at retail cost. This margin often proves a significant boon during freight market recessions.
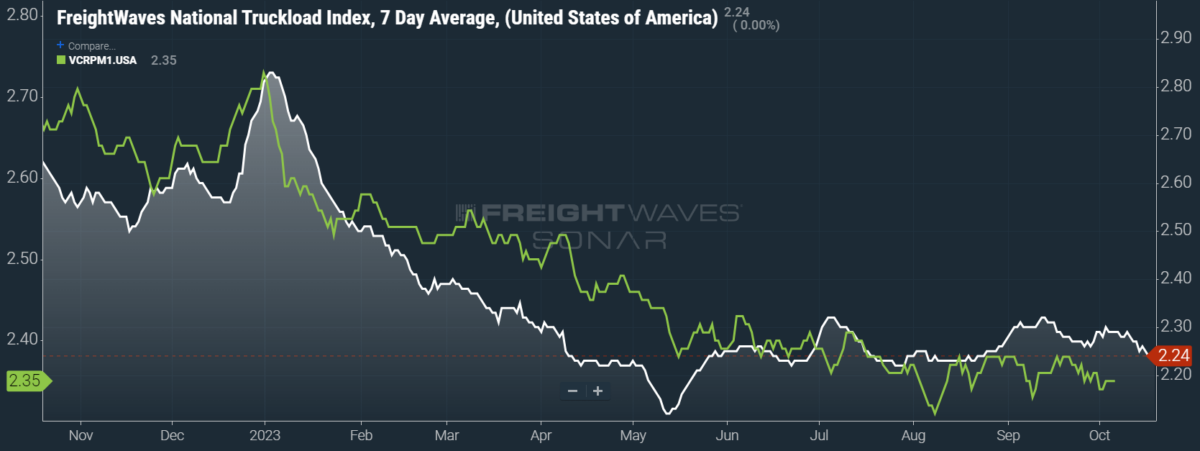
SONAR: National Truckload Index, 7-day average (white; right axis) and dry van contract rate (green; left axis).
To learn more about FreightWaves SONAR, click here.
This week, the National Truckload Index (NTI) — which includes fuel surcharges and other accessorials — fell 3 cents per mile to $2.24. Sliding linehaul rates were wholly responsible for this decline, as the linehaul variant of the NTI (NTIL) — which excludes fuel surcharges and other accessorials — fell 3 cents per mile w/w to $1.55.
Contract rates, which are reported on a two-week delay, are not entering Q4 with the boldest of strides. Since the majority of bids are historically conducted between early Q4 and mid-to-late Q2, the tempo of the contract market going into 2024 will not be known for a few weeks yet. For the time being, contract rates — which exclude fuel surcharges and other accessorials like the NTIL — are down 1 cent per mile w/w at $2.35.
To learn more about FreightWaves SONAR, click here.
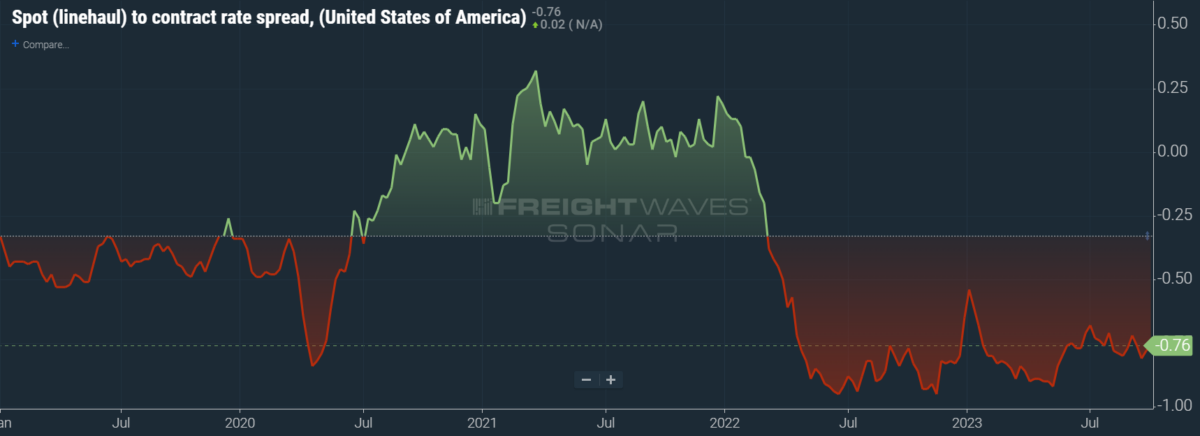
The chart above shows the spread between the NTIL and dry van contract rates, revealing the index has fallen to all-time lows in the data set, which dates to early 2019. Throughout that year, contract rates exceeded spot rates, leading to a record number of bankruptcies in the space. Once COVID-19 spread, spot rates reacted quickly, rising to record highs seemingly weekly, while contract rates slowly crept higher throughout 2021.
Despite this spread narrowing significantly early in the year, tightening by 20 cents per mile in January, it has remained wide throughout most of the year to date. As linehaul spot rates remain 76 cents below contract rates, there is still plenty of room for contract rates to decline — or for spot rates to rise — in the remainder of the year.
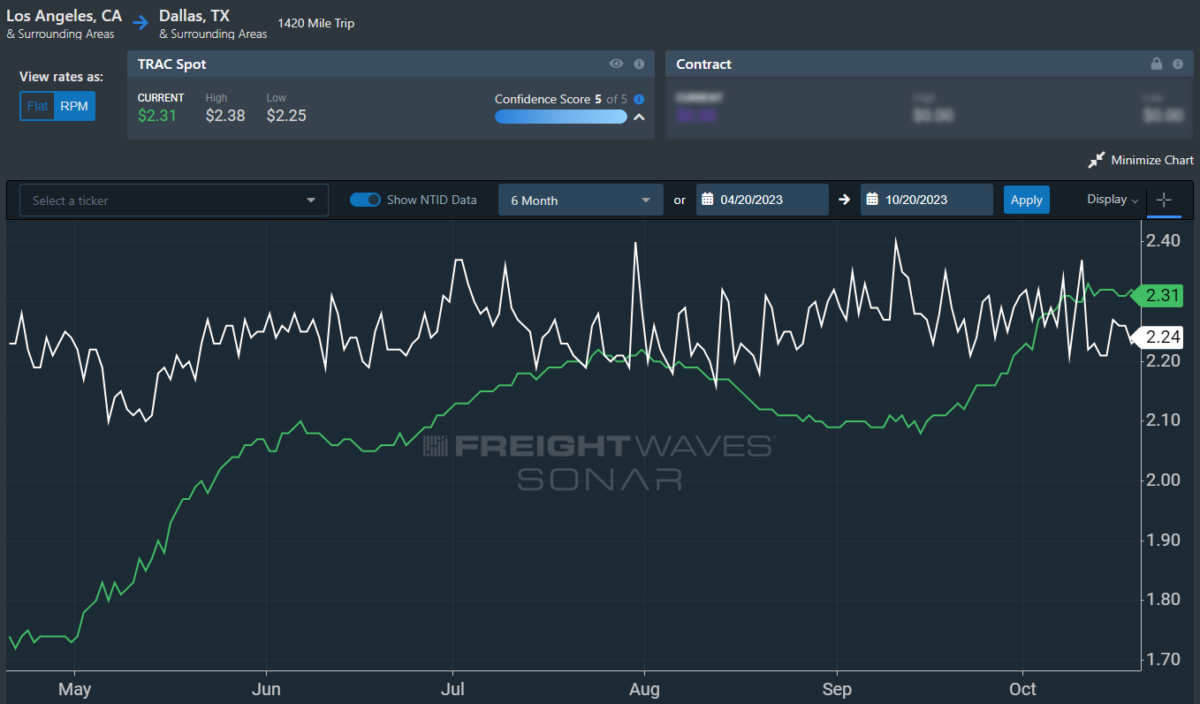
To learn more about FreightWaves TRAC, click here.
The FreightWaves Trusted Rate Assessment Consortium (TRAC) spot rate from Los Angeles to Dallas, arguably one of the densest freight lanes in the country, is still securing its footing. Over the past week, the TRAC rate was left unchanged at $2.31 per mile — still some distance from its year-to-date high of $2.39. The daily NTI (NTID), which has fallen to $2.24, is finally being outpaced by rates along this lane.
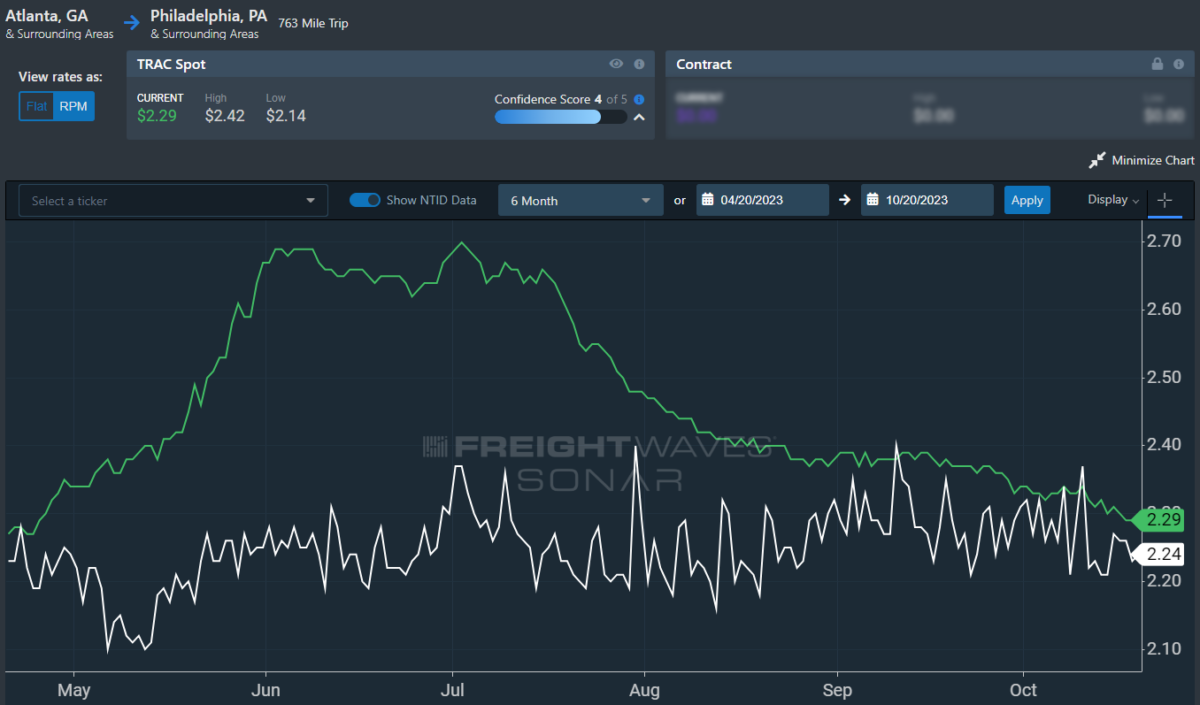
To learn more about FreightWaves TRAC, click here.
On the East Coast, especially out of Atlanta, rates have come down from July’s early peak but are still outpacing the NTID. The FreightWaves TRAC rate from Atlanta to Philadelphia fell 2 cents per mile to $2.29. After a bull run that started at the end of April, this lane had been plateauing above the national average, which made north-to-south lanes in the East more attractive than West Coast alternatives.
For more information on FreightWaves’ research, please contact Michael Rudolph at mrudolph@freightwaves.com or Tony Mulvey at tmulvey@freightwaves.com.
The post Seasonal depression appeared first on FreightWaves.
Source: freightwaves - Seasonal depression
Editor: Michael Rudolph