Freight News:
Reading the tea leaves
This week’s FreightWaves Supply Chain Pricing Power Index: 35 (Shippers)
Last week’s FreightWaves Supply Chain Pricing Power Index: 30 (Shippers)
Three-month FreightWaves Supply Chain Pricing Power Index Outlook: 35 (Shippers)
The FreightWaves Supply Chain Pricing Power Index uses the analytics and data in FreightWaves SONAR to analyze the market and estimate the negotiating power for rates between shippers and carriers.
This week’s Pricing Power Index is based on the following indicators:
What’s in your wallet?
On Monday, volumes hit a new year-to-date high after the holiday noise surrounding Labor Day finally dissipated. This trend is not unusual, as YTD highs were reached on this Monday in two out of the past four years (2019 and 2021). Nevertheless, it is an encouraging sign that freight markets are regaining some sense of normalcy. Any outlook for consumer demand during the upcoming holiday season will necessarily be mixed, since headwinds and tailwinds alternately abound.
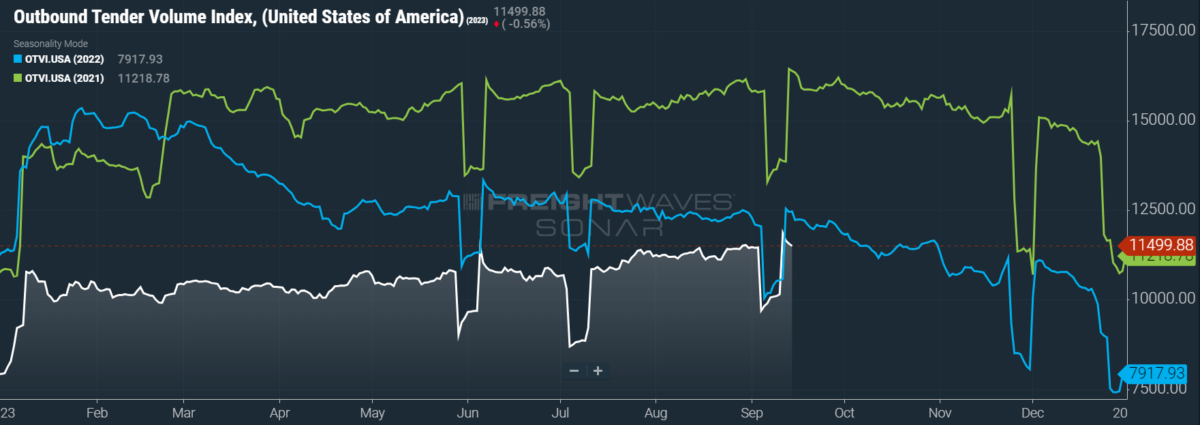
SONAR: OTVI.USA: 2023 (white), 2022 (blue) and 2021 (green)
To learn more about FreightWaves SONAR, click here.
This week, the Outbound Tender Volume Index (OTVI), which measures national freight demand by shippers’ requests for capacity, rose 0.5% on a two-week basis. (A two-week basis is used to ensure accurate comps in the week following a holiday.) On a year-over-year (y/y) basis, OTVI is down 6%, though such y/y comparisons can be colored by significant shifts in tender rejections. OTVI, which includes both accepted and rejected tenders, can be inflated by an uptick in the Outbound Tender Reject Index (OTRI).
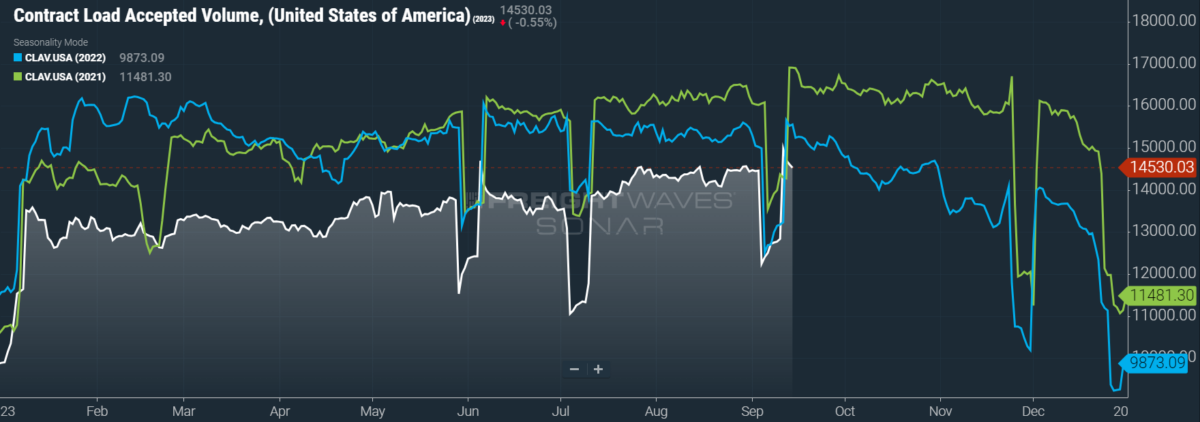
SONAR: CLAV.USA: 2023 (white), 2022 (blue) and 2021 (green)
To learn more about FreightWaves SONAR, click here.
Contract Load Accepted Volume (CLAV) is an index that measures accepted load volumes moving under contracted agreements. In short, it is similar to OTVI but without the rejected tenders. Looking at accepted tender volumes, we see a two-week rise of 0.3% as well as a fall of 5.9% y/y. This y/y difference confirms that actual cracks in freight demand — and not merely OTRI’s y/y decline — are driving OTVI lower, though the y/y gap is narrowing.
Perhaps the most pressing question for both freight markets and the broader economy is how the consumer will fare over the next few months. Before any evidence is presented for either the bull or bear case, it must be stated that American consumers continually defy expectations of weakening or collapse — it’s generally a bad idea to bet against them. That being said, revolving credit (which includes credit card debt) surged by $9.7 billion in July alone to a new all-time high of $1.27 trillion. This news is especially disappointing since, in June, revolving credit fell for the first time since April 2021.
Recent analysis by JPMorgan shows that U.S. consumers have burned through the entirety of their excess savings from the pandemic, which had topped $2 trillion in 2021. This analysis is corroborated by data from the U.S. Bureau of Economic Analysis, which marked July’s personal savings rate at 3.5% — its lowest since November of last year. Taken together, these figures point to a consumer in a tighter spot than initially hoped. In August, the Conference Board’s Consumer Confidence Index pulled back from two-year highs in July. Furthermore, its Expectations Index — which tracks survey respondents’ short-term outlook — fell to 80.2, just above the reading of 80 that historically signals a recession within the next year.
Inflation appears to be rearing its ugly head once more, if any believe that it ever stopped. August’s print of the Consumer Price Index revealed that headline inflation was up 0.6% on a monthly basis — triple that of May and June’s 0.2% monthly bumps. The headline index was also up 3.7% y/y, a touch higher than the 3.6% expected. Core inflation, which excludes goods with volatile pricing like food and energy, was up only 0.3% on a monthly basis and 4.3% y/y, down from a 4.7% y/y gain in July.
Some analysts are dismissing the headline number in favor of the core CPI, arguing that the rise was driven by a jump in energy prices. Although core inflation is a useful category, this line of thinking is one with which I largely disagree. Energy is an input universal to all goods and services and is a foundation of our economy. Consumers, meanwhile, pay for higher gasoline prices with the same wallet that they use for discretionary purchases. Supply-side inflation is also returning after months of softening, as August’s Producer Price Index was up 0.7% over July and 1.6% y/y, with final demand goods returning to inflationary territory after a string of y/y declines.
But there is still good news: Borrowers were far more prepared to resume student loan repayments than many analysts (including myself) had foreseen. In August, receipts corresponding to the U.S. Department of Education surged to $6.4 billion, compared to $2.1 billion in July and only $1.2 billion in June. Repayments are not scheduled to resume until October, and even then, there is a 12-month grace period in which interest will not capitalize and missed payments will not be reported to credit bureaus. Thus, it seemed likely that we would see a resurgence of loan payments in October that would slowly rise over the course of the grace period.
Why is this wave of preemptive repayments good news to the freight industry? It shows that borrowers had already adjusted their discretionary budgets with these loan payments in mind. Thus, it is less likely that holiday spending will suffer a surprise collapse, meaning that retail demand for freight should remain mostly consistent with seasonal trends.
One last piece of good news for the week: A confusing gap between initial jobless claims and monthly labor market data has been resolved after Ohio cracked down on potentially fraudulent filings for unemployment. On a non-seasonally adjusted basis, weekly initial jobless claims just dropped to their lowest level since September 2022. Per the last few monthly jobs reports, the labor market appears to be gliding toward a soft landing, as its influence is neither inflationary nor recessionary.
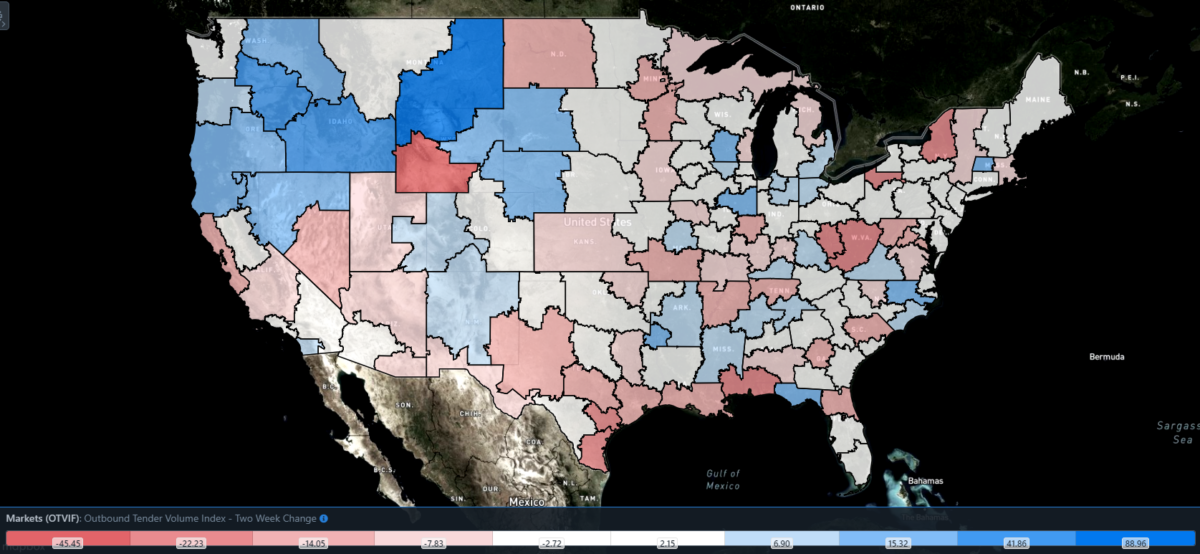
SONAR: Outbound Tender Volume Index – Two Week Change (OTVIF).
To learn more about FreightWaves SONAR, click here.
Of the 135 total markets, 73 reported increases in tender volumes on a two-week basis, though many of the largest markets did not share in the largest gains.
Detroit saw an uptick in shipper activity ahead of a strike by the United Auto Workers (UAW) labor union. The UAW had been threatening a strike for weeks, as efforts to negotiate labor contracts with the Detroit Three automakers — Ford, General Motors and Stellantis (formerly Chrysler) — foundered on demands for a 36% wage increase over four years, among other sticking points. The labor contracts previously in place expired at 11:59 p.m. on Thursday, and UAW members went on strike soon after. Of course, the longer the strike continues, the more truckload volumes from Detroit will suffer. But for now, freight demand is up 10.7% on a two-week basis in Detroit.
By mode: Facing less difficult comps than their reefer counterparts, van volumes were up more on a national basis than the overall OTVI. The Van Outbound Tender Volume Index (VOTVI) rose 1.52% on a two-week basis, while the Reefer Outbound Tender Volume Index (ROTVI) slid 0.37% over that same period. VOTVI should coast on seasonal trends for the rest of September, while ROTVI is unlikely to see such a seasonal boost until November.
Green shoots as the leaves fall
Remarkably, tender rejection rates are holding onto their previous gains and are remaining mostly stable around 4.3%. If this reading becomes the baseline for the coming weeks, OTRI should only benefit from holiday-induced spikes that might even outshine those of last year. While this news is worth celebrating for carriers, it is likely that OTRI’s gains have come at the expense of other carriers leaving a market oversaturated by capacity.
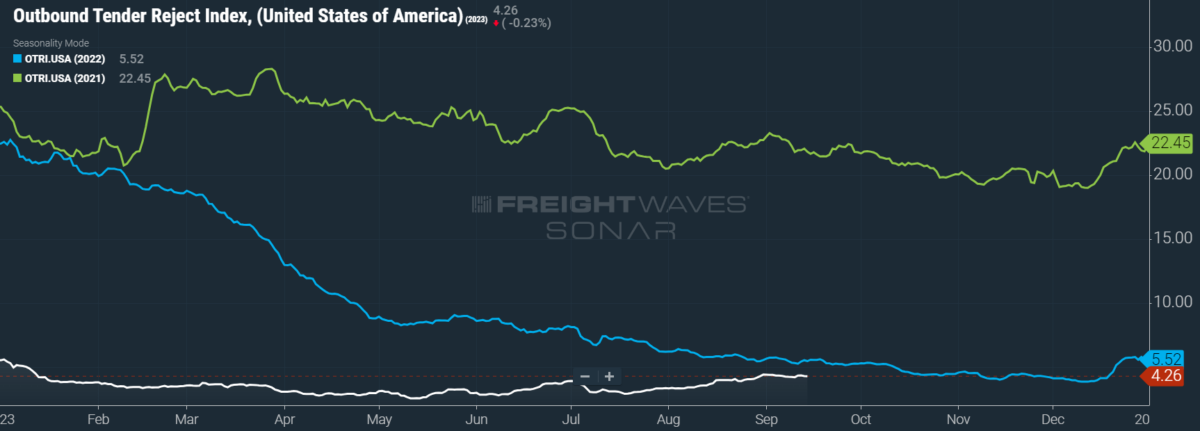
SONAR: OTRI.USA: 2023 (white), 2022 (blue) and 2021 (green)
To learn more about FreightWaves SONAR, click here.
Over the past week, OTRI, which measures relative capacity in the market, rose to 4.26%, a change of 3 basis points (bps) from the week prior. OTRI is now 129 bps below year-ago levels, with y/y comparisons becoming only more favorable even if OTRI just remains stable.
Following remarks made by President Shelley Simpson at an investor conference, J.B. Hunt Transport Services’ outlook for the future of freight demand is strikingly similar to our own: namely, that the industry has already suffered this cycle’s bottom and will continue to rebound gradually over the next few quarters. Simpson remarked that customers had accomplished the bulk of their destocking efforts and are “cautiously optimistic” that volumes will rise in the remainder of this year. Of course, contract rates still have room to decline relative to spot rates, and not all carriers will benefit equally from modest increases in shipper demand. But it should be an encouraging sign that the worst has likely passed.
Not without a hint of NIMBY-flavored irony, the California Senate has overwhelmingly voted to ban fully autonomous, driverless trucks from state highways. The bill, which passed in a 36-2 vote, now goes to Gov. Gavin Newsom, who could elect to approve or veto the legislation, though a veto would likely be ineffectual against the Senate’s staggering show of solidarity on this topic. Unsurprisingly, given that California is home to the Silicon Valley hub of tech companies, the bill has vocal opposition from the Autonomous Vehicle Industry Association, among others. But the bottom line is that the jobs of California truckers will be secured against autonomous vehicles for the time being.
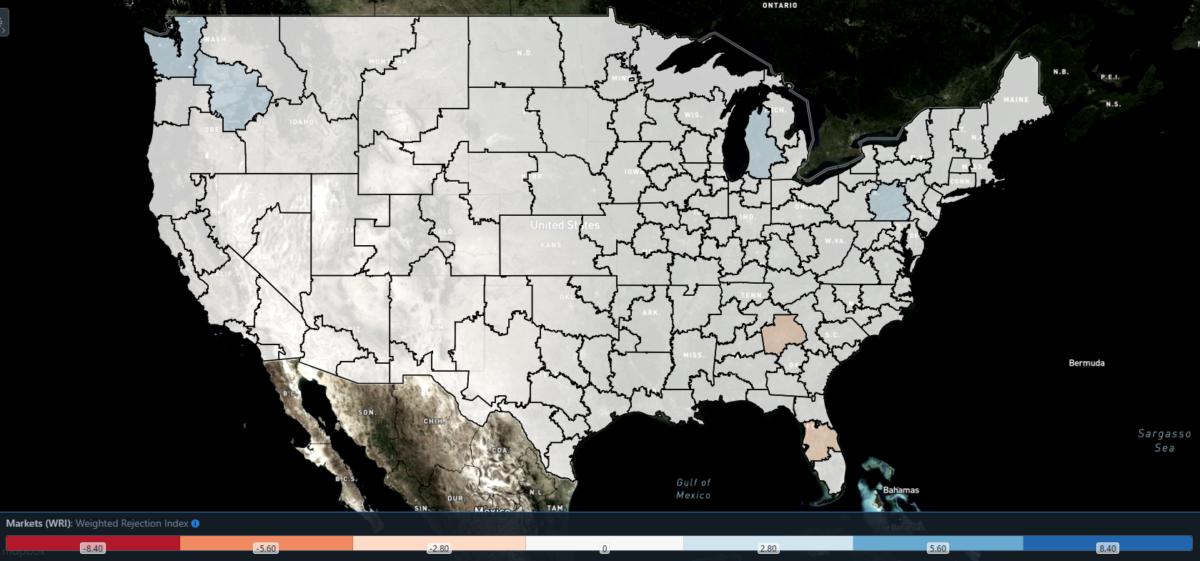
SONAR: WRI (color)
To learn more about FreightWaves SONAR, click here.
The map above shows the Weighted Rejection Index (WRI), the product of the Outbound Tender Reject Index – Weekly Change and Outbound Tender Market Share, as a way to prioritize rejection rate changes. As capacity is generally finding freight this week, only a few regions posted blue markets, which are usually the ones to focus on.
Of the 135 markets, 64 reported higher rejection rates over the past week, though 40 of those saw increases of only 100 or fewer bps.
To learn more about FreightWaves SONAR, click here.
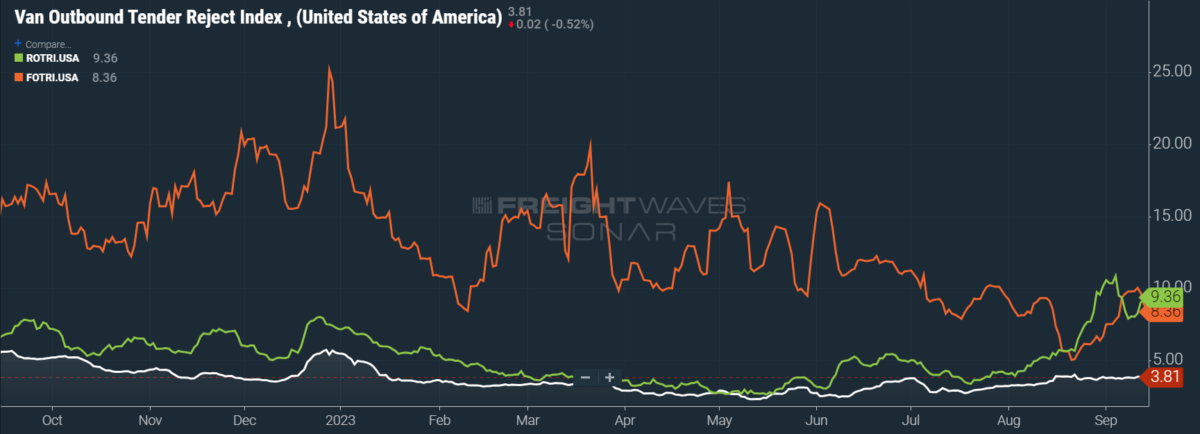
By mode: Following last week’s slight promise that flatbed rejection rates could stay in double-digit territory, the Flatbed Outbound Tender Reject Index (FOTRI) has once again succumbed to headwinds from the industrial and construction sectors. FOTRI fell to 8.36% after a 125 bps w/w tumble, though the index remains above its cycle low of 5.04% seen just a few weeks ago.
In contrast to ROTVI’s middling performance this week, reefer rejection rates are slowly climbing to their Labor Day peak of 10.86%. The Reefer Outbound Tender Reject Index (ROTRI) gained 91 bps w/w to hit 9.36%. As with reefer volumes, ROTRI should benefit from seasonal tightness in the coming months. Van rejection rates, meanwhile, are neither terrible nor terrific. The Van Outbound Tender Reject Index rose by only a single basis point w/w to 3.81%.
Energy prices heat up
On Thursday, prices of West Texas Intermediate crude — a domestic benchmark for oil prices — breached $90 per barrel for the first time since November 2022. This rally follows warnings from the International Energy Agency, which is typically bearish in its forecasts of oil demand, of a “significant supply shortfall” because of the Saudi-led OPEC+ production cuts. In short, diesel is about to get much more expensive.
This news would ordinarily be favorable for enterprise carriers with access to diesel at wholesale prices, since they can charge fuel surcharges to shippers at retail cost and profit from the spread. But retail prices are averaging a premium of only $1 per gallon, down considerably from the $1.35 spread averaged in September of last year. The margins of such carriers will therefore become thinner until rack prices rise at a rate commensurate with that of retail.
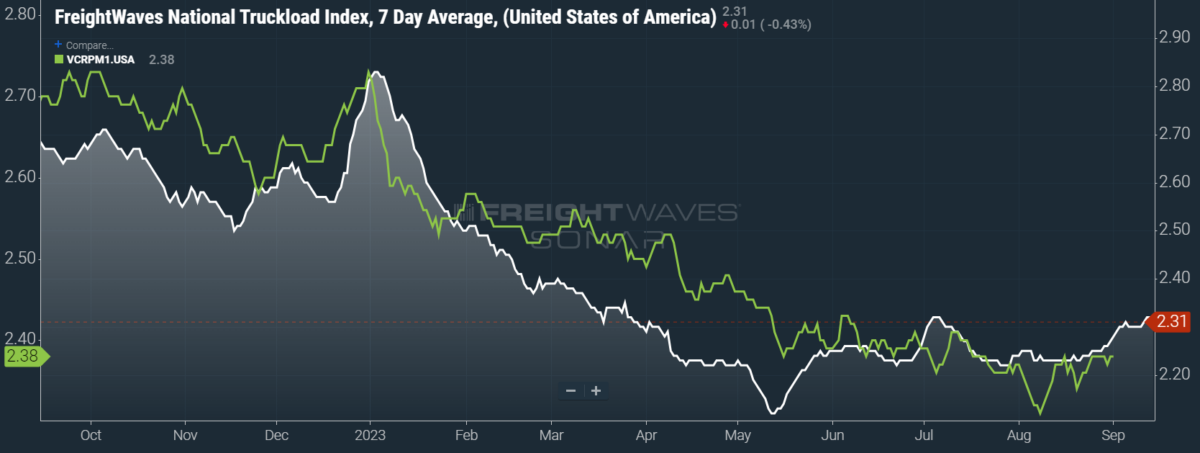
SONAR: National Truckload Index, 7-day average (white; right axis) and dry van contract rate (green; left axis).
To learn more about FreightWaves SONAR, click here.
This week, the National Truckload Index (NTI) — which includes fuel surcharges and other accessorials — rose 1 cent per mile to $2.31. Rising linehaul rates were solely responsible for this gain, as the linehaul variant of the NTI (NTIL) — which excludes fuel surcharges and other accessorials — similarly rose 1 cent per mile to $1.62.
Contract rates, which are reported on a two-week delay, have finally found their baseline for the third quarter with only a month to spare. The next pressing question is whether carriers will be able to capitalize on momentum in the spot market when negotiating contract rates for the fourth quarter, though their case will be helped by seasonal tightness in capacity. For the time being, contract rates — which exclude fuel surcharges and other accessorials like the NTIL — remain unchanged on a w/w basis at $2.38 per mile.
To learn more about FreightWaves SONAR, click here.
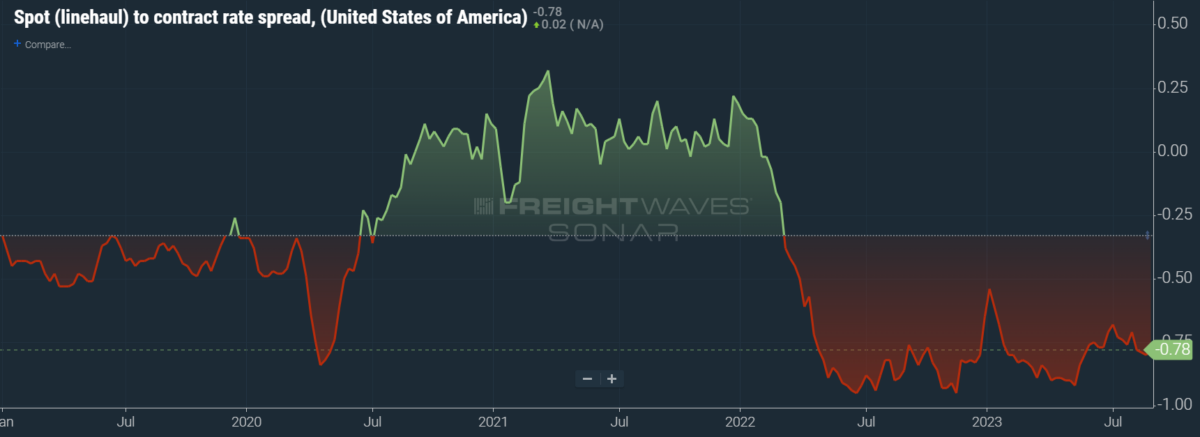
The chart above shows the spread between the NTIL and dry van contract rates, revealing the index has fallen to all-time lows in the data set, which dates to early 2019. Throughout that year, contract rates exceeded spot rates, leading to a record number of bankruptcies in the space. Once COVID-19 spread, spot rates reacted quickly, rising to record highs seemingly weekly, while contract rates slowly crept higher throughout 2021.
Despite this spread narrowing significantly early in the year, tightening by 20 cents per mile in January, it has widened again throughout the year to date. As linehaul spot rates remain 78 cents below contract rates, there is still plenty of room for contract rates to decline — or for spot rates to rise — in the remainder of the year.
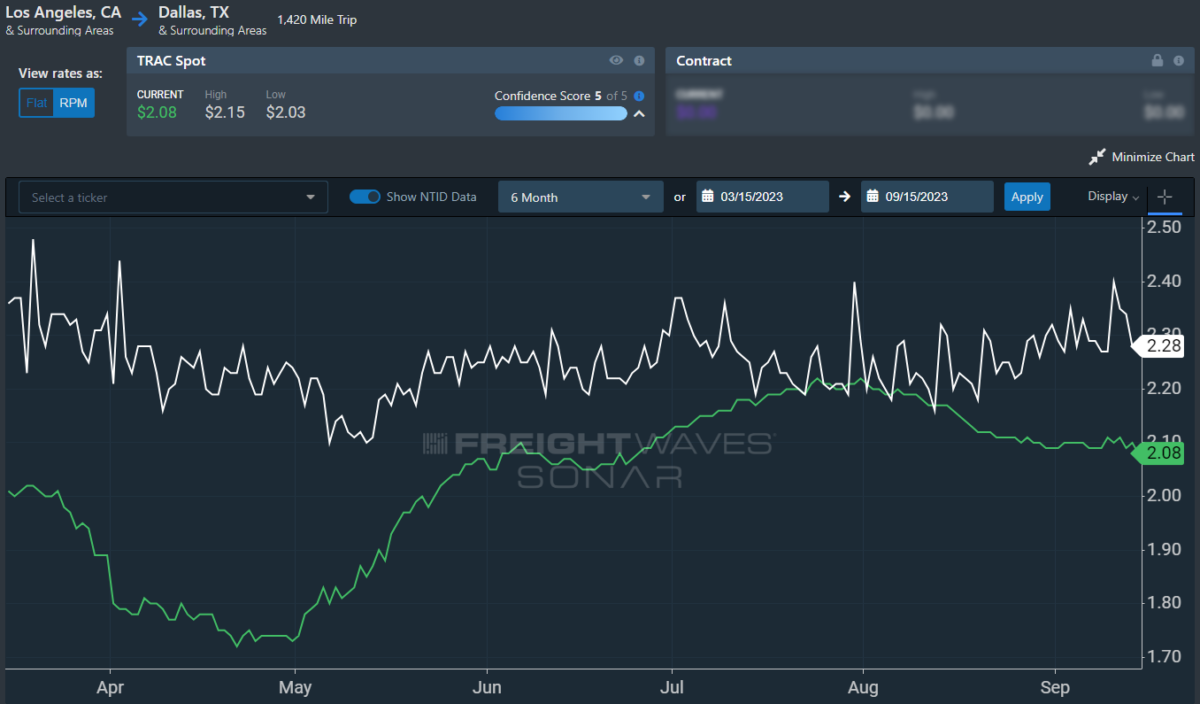
To learn more about FreightWaves TRAC, click here.
The FreightWaves Trusted Rate Assessment Consortium (TRAC) spot rate from Los Angeles to Dallas, arguably one of the densest freight lanes in the country, has seen a slowdown in its prior momentum. Over the past week, the TRAC rate fell 1 cent per mile to $2.08 — still some distance from its year-to-date high of $2.39. The daily NTI (NTID), which has fallen to $2.28, is handily outpacing rates along this lane.
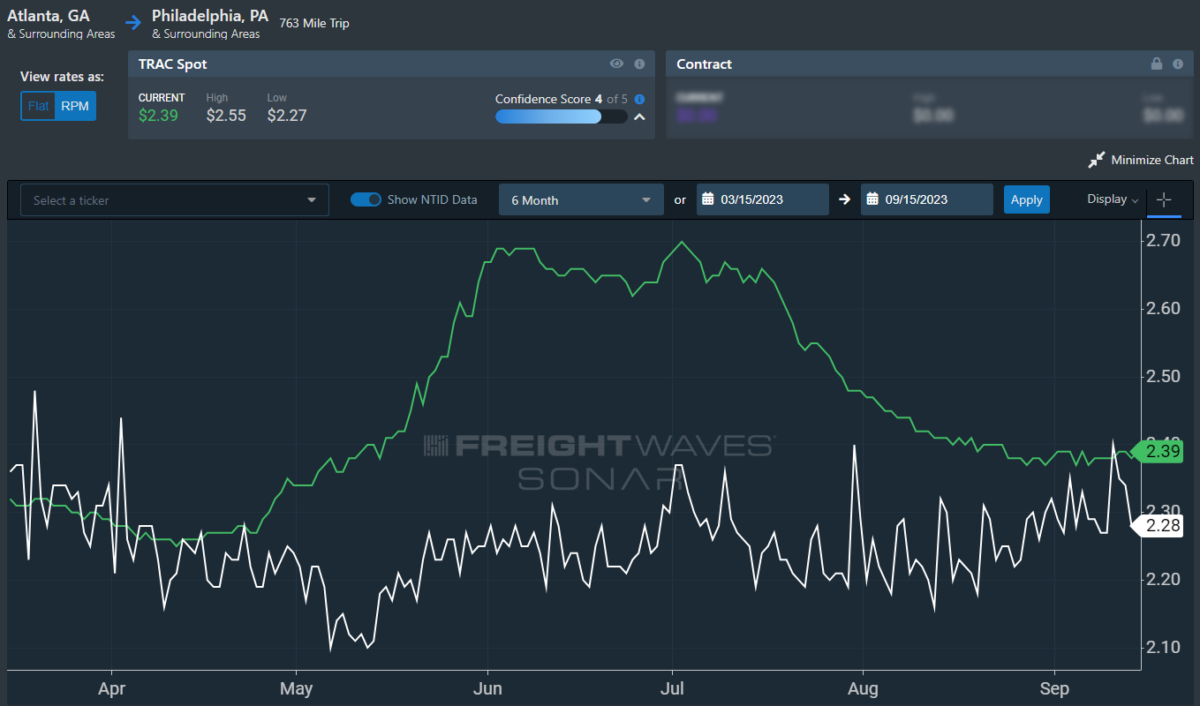
To learn more about FreightWaves TRAC, click here.
On the East Coast, especially out of Atlanta, rates have come down from July’s early peak but are still outpacing the NTID. The FreightWaves TRAC rate from Atlanta to Philadelphia gained 1 cent per mile to $2.39. After a bull run that started at the end of April, this lane had been plateauing above the national average, which made north-to-south lanes in the East far more attractive than West Coast alternatives.
For more information on FreightWaves’ research, please contact Michael Rudolph at mrudolph@freightwaves.com or Tony Mulvey at tmulvey@freightwaves.com.
The post Reading the tea leaves appeared first on FreightWaves.
Source: freightwaves - Reading the tea leaves
Editor: Michael Rudolph