Freight News:
Pumping the brakes
This week’s FreightWaves Supply Chain Pricing Power Index: 30 (Shippers)
Last week’s FreightWaves Supply Chain Pricing Power Index: 35 (Shippers)
Three-month FreightWaves Supply Chain Pricing Power Index Outlook: 35 (Shippers)
The FreightWaves Supply Chain Pricing Power Index uses the analytics and data in FreightWaves SONAR to analyze the market and estimate the negotiating power for rates between shippers and carriers.
This week’s Pricing Power Index is based on the following indicators:
Flimsy durables
Observant readers of this column might note that while the PPI did slide down to 30 this week, the three-month outlook remains unchanged at 35. This difference is not the result of some tidal wave of freight volume about to wash up on the market, as discussed last week. Rather, the upcoming months are littered with major holidays during which carriers can (and typically do) leverage seasonal constraints on capacity for higher spot rates.

SONAR: OTVI.USA: 2023 (white), 2022 (blue) and 2021 (green)
To learn more about FreightWaves SONAR, click here.
This week, the Outbound Tender Volume Index (OTVI), which measures national freight demand by shippers’ requests for capacity, is up 1.43% week over week (w/w). On a year-over-year (y/y) basis, OTVI is down 4.12%, though such y/y comparisons can be colored by significant shifts in tender rejections. OTVI, which includes both accepted and rejected tenders, can be inflated by an uptick in the Outbound Tender Reject Index (OTRI).

SONAR: CLAV.USA: 2023 (white), 2022 (blue) and 2021 (green)
To learn more about FreightWaves SONAR, click here.
Contract Load Accepted Volume (CLAV) is an index that measures accepted load volumes moving under contracted agreements. In short, it is similar to OTVI but without the rejected tenders. Looking at accepted tender volumes, we see a rise of 0.7% w/w as well as a fall of 2.64% y/y. This narrowing y/y difference implies that actual freight flow is still recovering from this cycle’s bottom.
Earlier this week, the Bureau of Economic Analysis released gross domestic product data from the third quarter. Per the BEA’s advance estimate, GDP increased 4.9% annualized in Q3 — appreciably higher than consensus estimates of 4.5% growth, though slightly below some high-end whisper numbers of 5.5%. The primary driver of Q3’s gains was personal consumption expenditures; spending on services and goods contributed a roughly equal amount to overall GDP growth.
Personal goods consumption skyrocketed from an annualized 0.5% in Q2 to 4.8% in Q3. The majority of this meteoric rise was attributed to spending on durable goods — specifically on recreational goods such as televisions, computers and music — which rose from a 0.3% annualized drop in Q2 to a staggering 7.6% gain in Q3. For freight markets, this durable goods spending is a double-edged sword since, as the name implies, such goods are built to last and are thus purchased infrequently.
Moreover, the depth of this spending in Q3 bodes poorly for consumer activity in the near future. Per data from the Federal Reserve, the total amount of revolving credit — which includes credit card debt — rose a massive 13.9% annualized in August. Given strong retail sales data from September as well as major sales events in October, this upward trend is likely to persist for the time being. Of course, it is also growing more expensive to hold such debt, as the average interest rate on a credit card plan is now an eye-watering 21.2%.

SONAR: Outbound Tender Volume Index – Weekly Change (OTVIW).
To learn more about FreightWaves SONAR, click here.
Of the 135 total markets, 66 reported weekly increases in tender volumes, with most of the gains relegated to midsize markets.
Heartache and congestion
It is becoming increasingly difficult to look at tender rejections without feeling some disappointment. OTRI has dipped below its Q3 average of 3.67%, losing all gains realized since mid-August. While this column focuses on the weekly movements of key metrics, it is important to stress that OTRI’s movements from 3% to 4% do not reflect major changes in freight markets. Rather, these numbers point to the direction and rate of change in the market’s momentum.
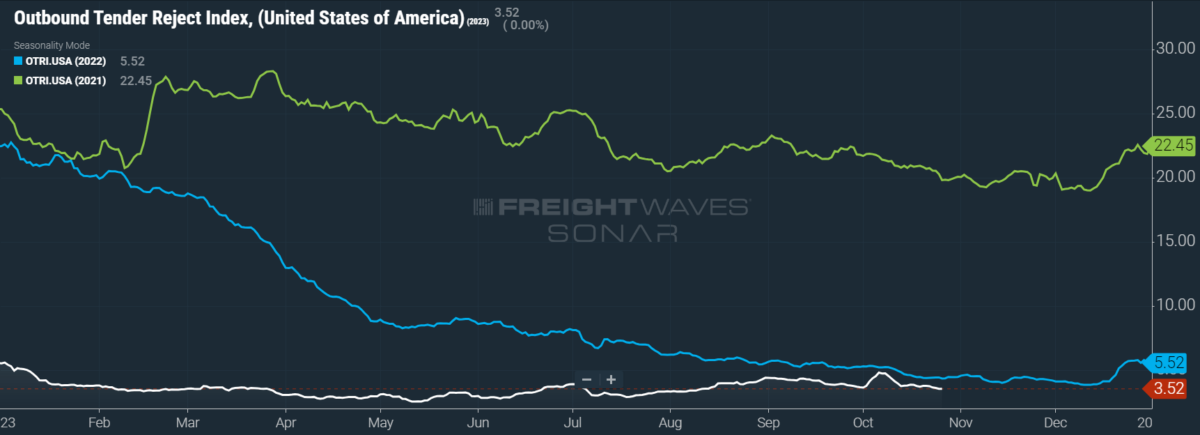
SONAR: OTRI.USA: 2023 (white), 2022 (blue) and 2021 (green)
To learn more about FreightWaves SONAR, click here.
Over the past week, OTRI, which measures relative capacity in the market, fell to 3.52%, a change of 17 basis points from the week prior. OTRI is now 81 bps below year-ago levels, with y/y comparisons becoming more favorable even if OTRI just remains more or less stable.
A new study conducted by the American Transportation Research Institute reports that, in 2021, congestion on the roads cost trucking companies a record $94.6 billion. Though often a drain on carriers’ margins, running up tabs for driver compensation and fuel consumption, congestion can be a boon to truckers in favorable markets. Markets prone to congestion — such as Nevada, California, Georgia and Louisiana — can be tighter than others and therefore spun into profitable lanes. While congestion impacts carriers differently based on size and regions of operations, the study found that the average cost per truck was $6,824 annually. With any luck, at least some of the $184.5 billion allocated to over-the-road infrastructure improvements by the 2021 Infrastructure Investment and Jobs Act will go toward alleviating congestion.

SONAR: WRI (color)
To learn more about FreightWaves SONAR, click here.
The map above shows the Weighted Rejection Index (WRI), the product of the Outbound Tender Reject Index – Weekly Change and Outbound Tender Market Share, as a way to prioritize rejection rate changes. As capacity is generally finding freight this week, no regions posted blue markets, which are usually the ones to focus on.
Of the 135 markets, 59 reported higher rejection rates over the past week, though 38 of those saw increases of only 100 or fewer bps.
Cooling oil markets temper fuel costs
Three weeks after the outbreak of war in the Middle East, oil prices’ rally has fizzled out despite strengthening fundamentals. Part of this failure to reach $100-a-barrel oil stems from economic headwinds continuing to send recessionary shivers down traders’ spines. But the costs of transporting oil have also risen amid the geopolitical uncertainties, dampening demand further. Despite its regional entanglements, Saudi Arabia has proven to be a mostly rational actor with regard to its oil production. While Saudi Arabia (and thus OPEC) appears to be ready to add supply back to the market if prices get too hot, the current price stagnation will incentivize them to continue their production cuts until 2024 at least.

SONAR: National Truckload Index, 7-day average (white; right axis) and dry van contract rate (green; left axis).
To learn more about FreightWaves SONAR, click here.
This week, the National Truckload Index (NTI) — which includes fuel surcharges and other accessorials — fell 2 cents per mile to $2.22. Sliding linehaul rates were wholly responsible for this decline, as the linehaul variant of the NTI (NTIL) — which excludes fuel surcharges and other accessorials — fell 3 cents per mile w/w to $1.52.
Contract rates, which are reported on a two-week delay, have recovered from a brief dip and returned to Q3’s average. Bid season is still underway and will be until March or April 2024, so shippers have yet to bring contract rates into balance with supply. The spread between linehaul spot rates and contract rates — which exclude fuel surcharges and other accessorials like the NTIL — remains abnormally wide, so shippers do have plenty of pricing power left to flex. That said, they might decide that securing long-term capacity is more important than short-term profits, keeping rates high during the market’s recovery. For the time being, contract rates are up 2 cents per mile w/w to $2.37.

To learn more about FreightWaves SONAR, click here.
The chart above shows the spread between the NTIL and dry van contract rates, revealing the index has fallen to all-time lows in the data set, which dates to early 2019. Throughout that year, contract rates exceeded spot rates, leading to a record number of bankruptcies in the space. Once COVID-19 spread, spot rates reacted quickly, rising to record highs seemingly weekly, while contract rates slowly crept higher throughout 2021.
Despite this spread narrowing significantly early in the year, tightening by 20 cents per mile in January, it has remained wide throughout most of the year to date. As linehaul spot rates remain 80 cents below contract rates, there is plenty of room for contract rates to decline — or for spot rates to rise — in the final quarter of the year.

To learn more about FreightWaves TRAC, click here.
The FreightWaves Trusted Rate Assessment Consortium (TRAC) spot rate from Los Angeles to Dallas, arguably one of the densest freight lanes in the country, is still securing its footing. Over the past week, the TRAC rate was left unchanged at $2.31 per mile — still some distance from its year-to-date high of $2.39. The daily NTI (NTID), which has fallen to $2.21, is finally being outpaced by rates along this lane.

To learn more about FreightWaves TRAC, click here.
On the East Coast, especially out of Atlanta, rates have come down from the summer’s peak but are still outpacing the NTID. The FreightWaves TRAC rate from Atlanta to Philadelphia fell 4 cents per mile to $2.25. After a bull run that started at the end of April, this lane had been plateauing above the national average, which made north-to-south lanes in the East more attractive than West Coast alternatives.
For more information on FreightWaves’ research, please contact Michael Rudolph at mrudolph@freightwaves.com or Tony Mulvey at tmulvey@freightwaves.com.
The post Pumping the brakes appeared first on FreightWaves.
Source: freightwaves - Pumping the brakes
Editor: Michael Rudolph