Playing the waiting game
This week’s FreightWaves Supply Chain Pricing Power Index: 35 (Shippers)
Last week’s FreightWaves Supply Chain Pricing Power Index: 35 (Shippers)
Three-month FreightWaves Supply Chain Pricing Power Index Outlook: 35 (Shippers)
The FreightWaves Supply Chain Pricing Power Index uses the analytics and data in FreightWaves SONAR to analyze the market and estimate the negotiating power for rates between shippers and carriers.
This week’s Pricing Power Index is based on the following indicators:
Rising energy prices reignite inflation
After peaking at a year-to-date high last week, tender volumes have remained more or less stable in the latter half of September. Consumer demand during the holiday season is expected to be relatively soft, which should temper expectations for a red-hot peak season in truckload markets. But the market appears to be more sensitive to seasonal trends on the whole, and so volumes should nevertheless get a boost in the fourth quarter of 2023.
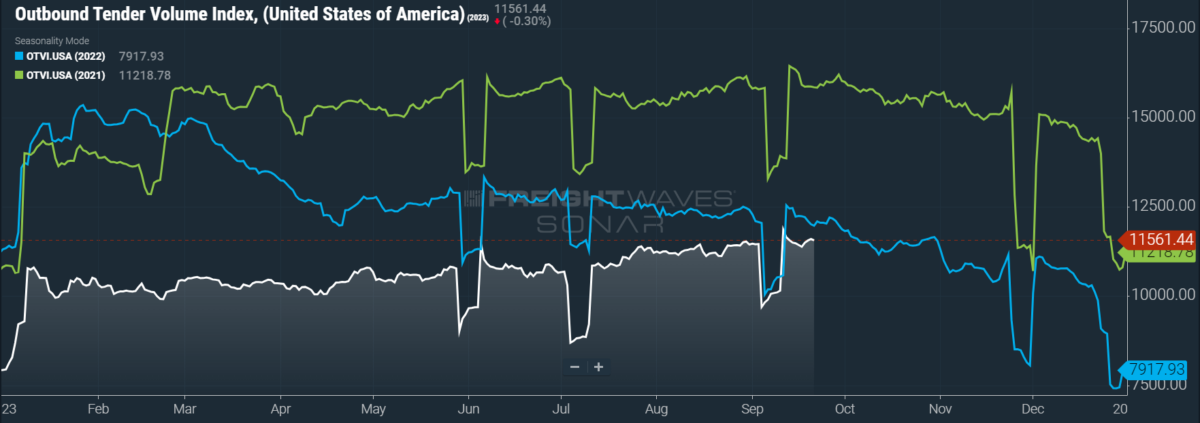
SONAR: OTVI.USA: 2023 (white), 2022 (blue) and 2021 (green)
To learn more about FreightWaves SONAR, click here.
This week, the Outbound Tender Volume Index (OTVI), which measures national freight demand by shippers’ requests for capacity, rose 0.54% week over week (w/w). On a year-over-year (y/y) basis, OTVI is down 4.37%, though such y/y comparisons can be colored by significant shifts in tender rejections. OTVI, which includes both accepted and rejected tenders, can be inflated by an uptick in the Outbound Tender Reject Index (OTRI).
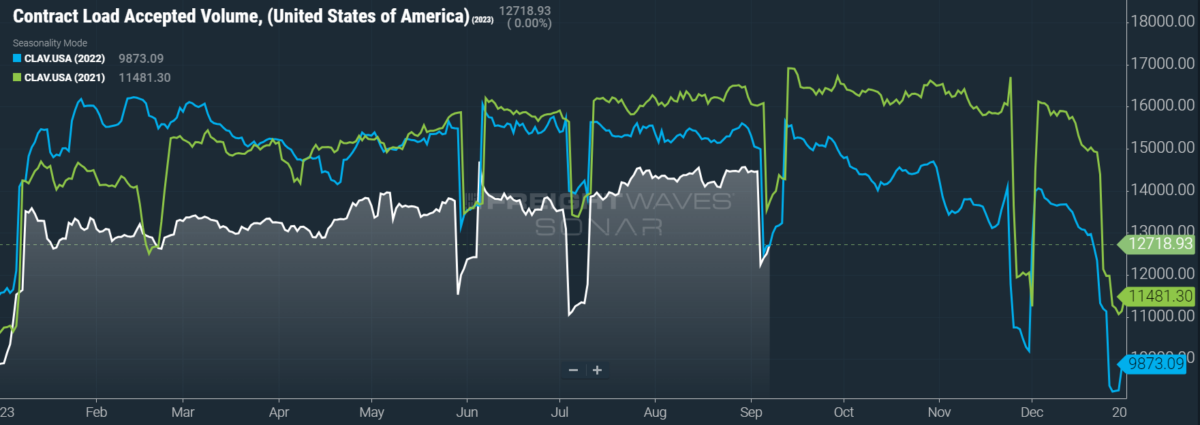
SONAR: CLAV.USA: 2023 (white), 2022 (blue) and 2021 (green)
To learn more about FreightWaves SONAR, click here.
Contract Load Accepted Volume (CLAV) is an index that measures accepted load volumes moving under contracted agreements. In short, it is similar to OTVI but without the rejected tenders. Looking at accepted tender volumes, we see a rise of 0.7% w/w as well as a fall of 2.02% y/y. This y/y difference confirms that actual cracks in freight demand — and not merely OTRI’s y/y decline — are driving OTVI lower.
As has been par for the course the past several months, the U.S. economy continues to broadcast confusing signals that many hope are indicative of an eventual “soft landing” — that is, taming inflation without triggering a recession. At its most recent meeting in late September, the Federal Reserve reacted appropriately to such surprising data: that is to say, surprisingly. While the Fed did extend its pause on interest rate hikes, it all but penciled in an additional hike for 2023. Moreover, the Fed stated its intentions to hold interest rates higher for longer than was previously expected, though — as with all comments from the Fed — the new forecast might be a tool to scare investors without actually exercising fiscal tightening.
The resurgence of inflation is nevertheless a real threat, as August’s release of the Consumer Price Index (CPI) revealed. In August, the headline index rose 0.6% m/m — triple that of June and July’s 0.2% m/m bumps. The headline CPI was also up 3.7% y/y, narrowly above consensus expectations of a 3.6% y/y gain. The core CPI, which excludes goods with volatile pricing like food and energy, remained stickier at 4.3% y/y growth, although it did rise at a slower pace (0.3% m/m) and cooled from July’s 4.7% y/y gain. Of course, the main worry is that the biggest driver of disinflation over several months — energy prices — is now threatening to bring back rapid inflation single-handedly.
As a major input for manufacturers, energy prices are also driving up supply-side inflation, which would then trickle down to consumer-facing inflation over time. August’s release of the Producer Price Index (PPI) — which tracks inflationary pressures faced by producers across a number of industries, and which is not to be confused with the Pricing Power Index — showed that the PPI for final demand shot up 0.7% m/m, the largest such gain since June 2022. The PPI for final demand goods was also up 0.5% y/y after three consecutive months of negative y/y growth, driven mostly by a 10.5% m/m surge in prices for final demand energy.
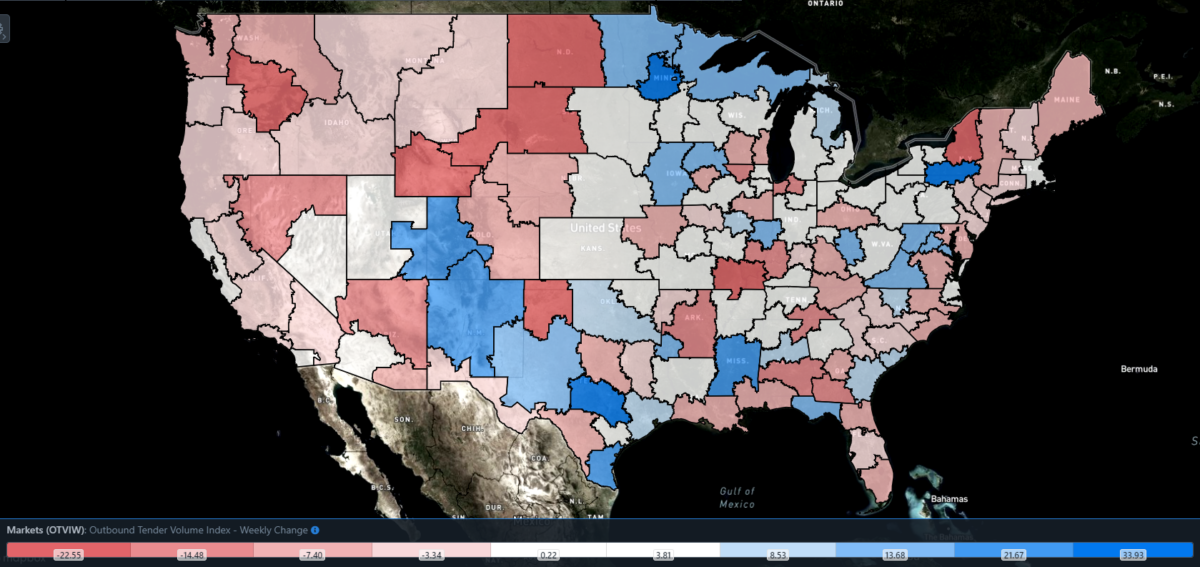
SONAR: Outbound Tender Volume Index – Weekly Change (OTVIW).
To learn more about FreightWaves SONAR, click here.
Of the 135 total markets, 66 reported weekly increases in tender volumes, with many of the largest markets showing a mixed performance.
Case in point: The truckload markets of Ontario, California, and Houston tell a tale of two ports. On the one coast is Port Houston, which is bustling with imports and exports alike as the energy sector becomes top of mind for many segments of the economy. Truckload demand was up 11.8% w/w in Houston. But on the other coast is the port complex of Los Angeles and Long Beach, coming down from its pandemic-induced surge of Chinese imports. The Ontario market, which houses a vast network of warehouses and distribution centers that handle such imports, saw freight demand slide 0.63% w/w.
By mode: At the time of writing, reefer demand is closer to 2022 than 2019: Far from a backhanded compliment, this comparison highlights the continued resilience of reefer markets in the transitional period between summer and winter. Harvests from the Pacific Northwest are keeping reefer volumes high in the autumn, but the Reefer Outbound Tender Volume Index has nevertheless fallen 3.67% w/w.
Van volumes, on the other hand, face somewhat easier comps but are excelling regardless. Consumer-driven freight demand should remain steady over the coming weeks, even if trends fail to capture the exciting volatility of a normal peak season. At present, the Van Outbound Tender Volume Index (VOTVI) is up 1.46% w/w.
Headaches at the border
Rejection rates have fallen quite a bit in the back half of September, though they remain comparable to levels seen in mid-January. Even in 2021, the busiest freight market on record, rejection rates began to slide around this time of year, so OTRI’s current tumble is not especially alarming. All else being equal, however, a falling OTRI does translate to pricing power that shifts more toward shippers than carriers.
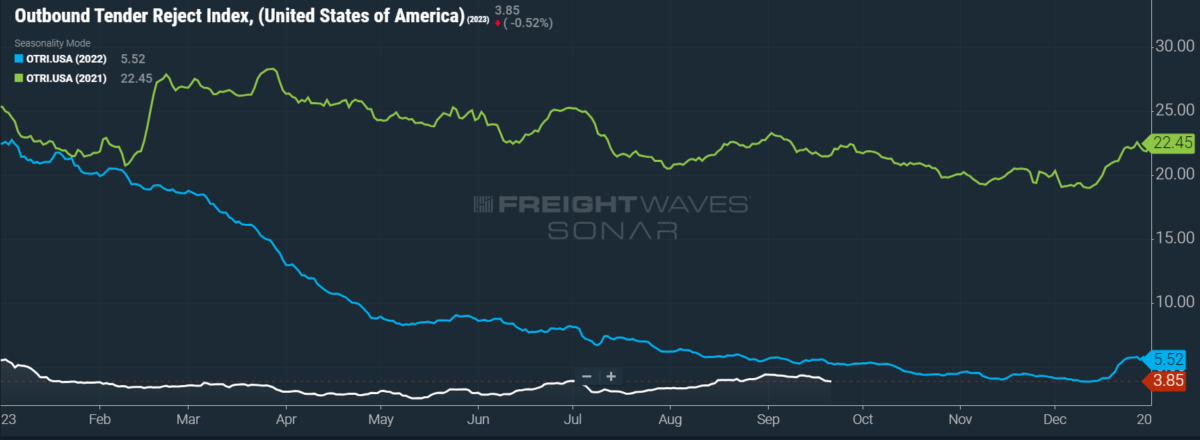
SONAR: OTRI.USA: 2023 (white), 2022 (blue) and 2021 (green)
To learn more about FreightWaves SONAR, click here.
Over the past week, OTRI, which measures relative capacity in the market, fell to 3.85%, a change of 41 basis points from the week prior. OTRI is now 142 bps below year-ago levels, with y/y comparisons becoming more favorable even if OTRI just remains stable.
Manufacturers are by and large seeking to divest their operations from China and either reshore them to the U.S. or else nearshore them to Mexico. But in a sign that cross-border trade faces its own unique challenges, the Texas Department of Public Safety (DPS) is cracking down on drug smuggling and human trafficking with a barrage of truck inspections. Cargo truck wait times at one cross-border bridge have risen to more than 100 minutes, while another bridge is struggling with wait times north of three hours. Moreover, even rail traffic is being put on hold as Union Pacific announced a delay in freight service through South Texas.
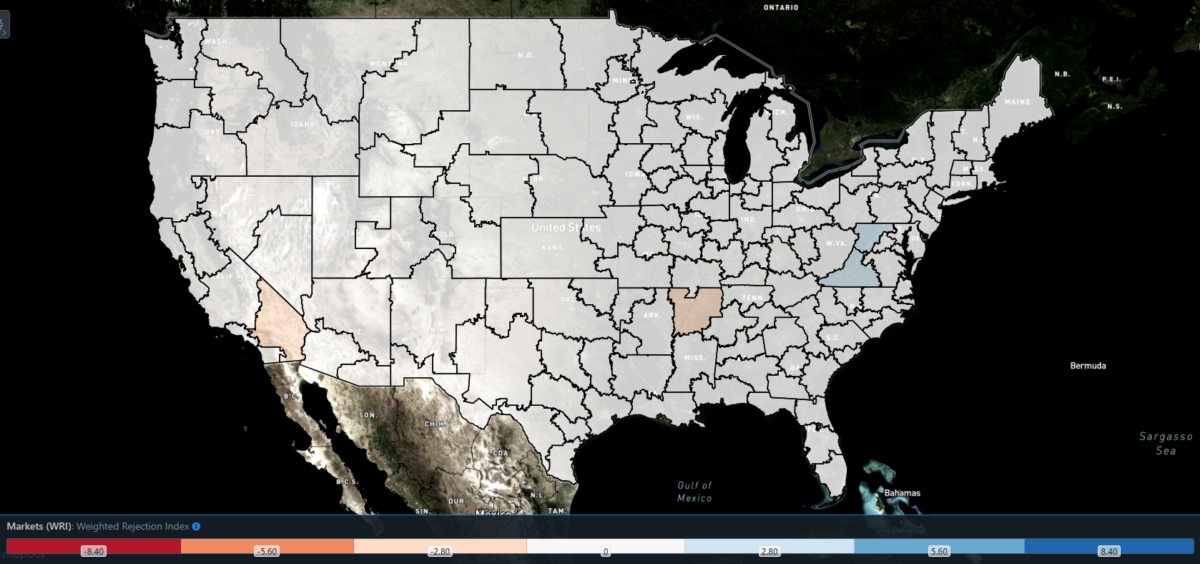
SONAR: WRI (color)
To learn more about FreightWaves SONAR, click here.
The map above shows the Weighted Rejection Index (WRI), the product of the Outbound Tender Reject Index – Weekly Change and Outbound Tender Market Share, as a way to prioritize rejection rate changes. As capacity is generally finding freight this week, only a few regions posted blue markets, which are usually the ones to focus on.
Of the 135 markets, 48 reported higher rejection rates over the past week, though 26 of those saw increases of only 100 or fewer bps.
To learn more about FreightWaves SONAR, click here.
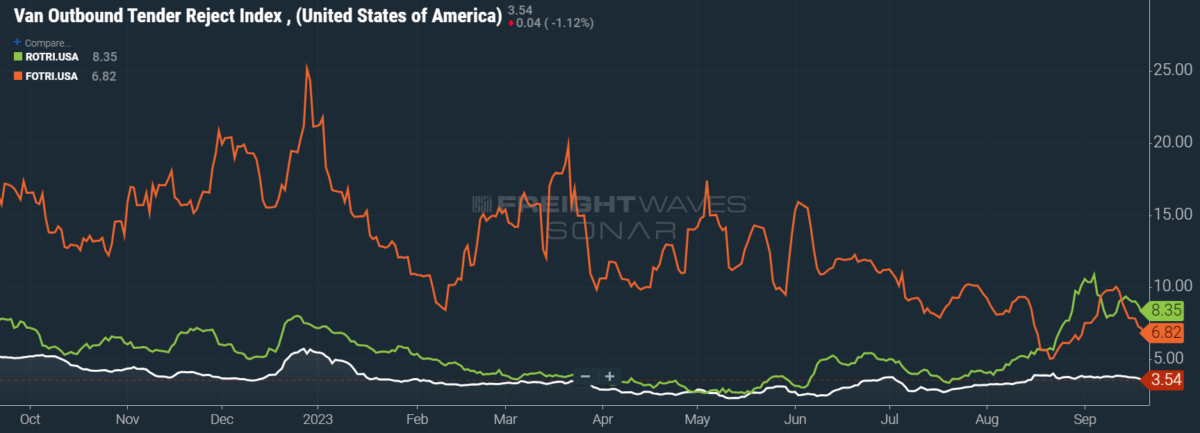
By mode: Thanks in large part to harvests coming out of the Pacific Northwest, reefer demand continues to be strong, giving increased leverage to carriers when naming rates. Like those of other modes, reefer rejection rates benefited from a healthy bump around Labor Day, but that is where the comparisons end. After falling from this holiday peak, reefer rejection rates actually managed to tick up in the following weeks, remaining more or less where they were at the end of August. At present, the Reefer Outbound Tender Reject Index (ROTRI) sits at 8.35% after a 101-bp w/w fall. The longer that rejection rates linger close to the double-digit mark, the higher that reefer spot rates will be going into the winter. If this winter season proves to be especially cold, shippers of all stripes will seek to insulate their freight against extreme weather by switching to temperature-controlled modes.
Other modes are not so lucky, but the outlook for flatbed rejection rates is especially dim. When reefers and dry vans began to suffer from last year’s market downturn, flatbed rejection rates remained consistently above 10% if not 15%. But in the back half of 2023 so far, the Flatbed Outbound Tender Reject Index (FOTRI) is struggling against numerous headwinds: For a start, the industrial economy and the construction sector are heavily impacted by high federal interest rates. FOTRI is now at 6.82% after a costly decline of 154 bps w/w.
Spot the bull
Any outlook for spot rates should all but guarantee growth in the coming months. Not only is Q4 riddled with holidays and their corresponding capacity crunches, but the price of diesel is threatening to rise exponentially as crude oil markets finally succumb to the Saudi-led OPEC+ production cuts, which are expected to remain in place for the rest of 2023. The current rise in diesel prices is not felt equally in all regions, as most California markets are already seeing prices well above $6 per gallon. In most markets along the Gulf Coast, however, diesel is still roughly $4 per gallon at the time of writing.
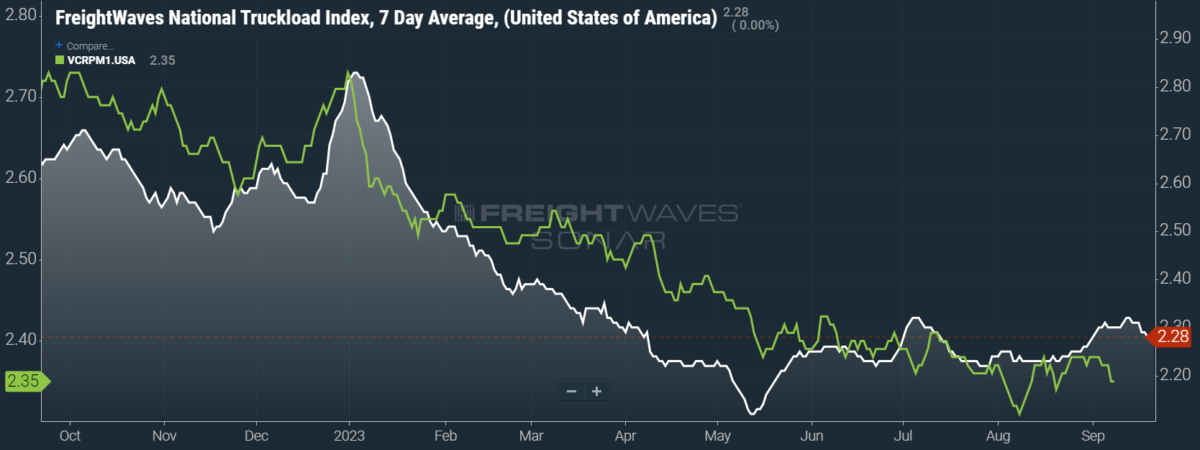
SONAR: National Truckload Index, 7-day average (white; right axis) and dry van contract rate (green; left axis).
To learn more about FreightWaves SONAR, click here.
This week, the National Truckload Index (NTI) — which includes fuel surcharges and other accessorials — fell 3 cents per mile to $2.28. Declining linehaul rates were partially offset by rising diesel costs, as the linehaul variant of the NTI (NTIL) — which excludes fuel surcharges and other accessorials — fell 5 cents per mile w/w to $1.57.
Contract rates, which are reported on a two-week delay, are showing signs of having lost their Labor Day momentum. But unlike the NTI, contract rates treat fuel costs as a passthrough and so will not be strongly affected by the rise in diesel prices. Instead, contract rates’ next major change should come once the Q4 round of negotiations is reflected in data from late October. For the time being, contract rates — which exclude fuel surcharges and other accessorials like the NTIL — are down 3 cents per mile w/w at $2.35.
To learn more about FreightWaves SONAR, click here.
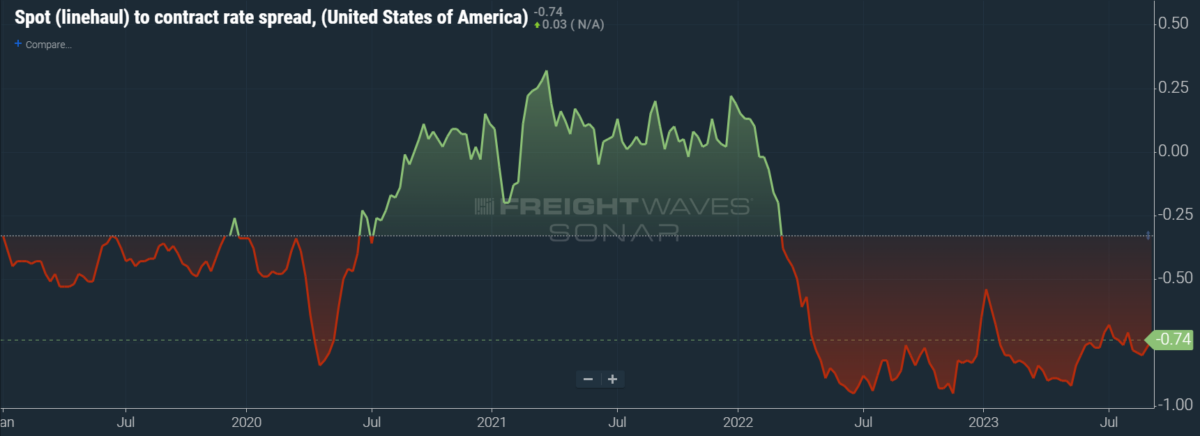
The chart above shows the spread between the NTIL and dry van contract rates, revealing the index has fallen to all-time lows in the data set, which dates to early 2019. Throughout that year, contract rates exceeded spot rates, leading to a record number of bankruptcies in the space. Once COVID-19 spread, spot rates reacted quickly, rising to record highs seemingly weekly, while contract rates slowly crept higher throughout 2021.
Despite this spread narrowing significantly early in the year, tightening by 20 cents per mile in January, it has widened again throughout the year to date. As linehaul spot rates remain 74 cents below contract rates, there is still plenty of room for contract rates to decline — or for spot rates to rise — in the remainder of the year.
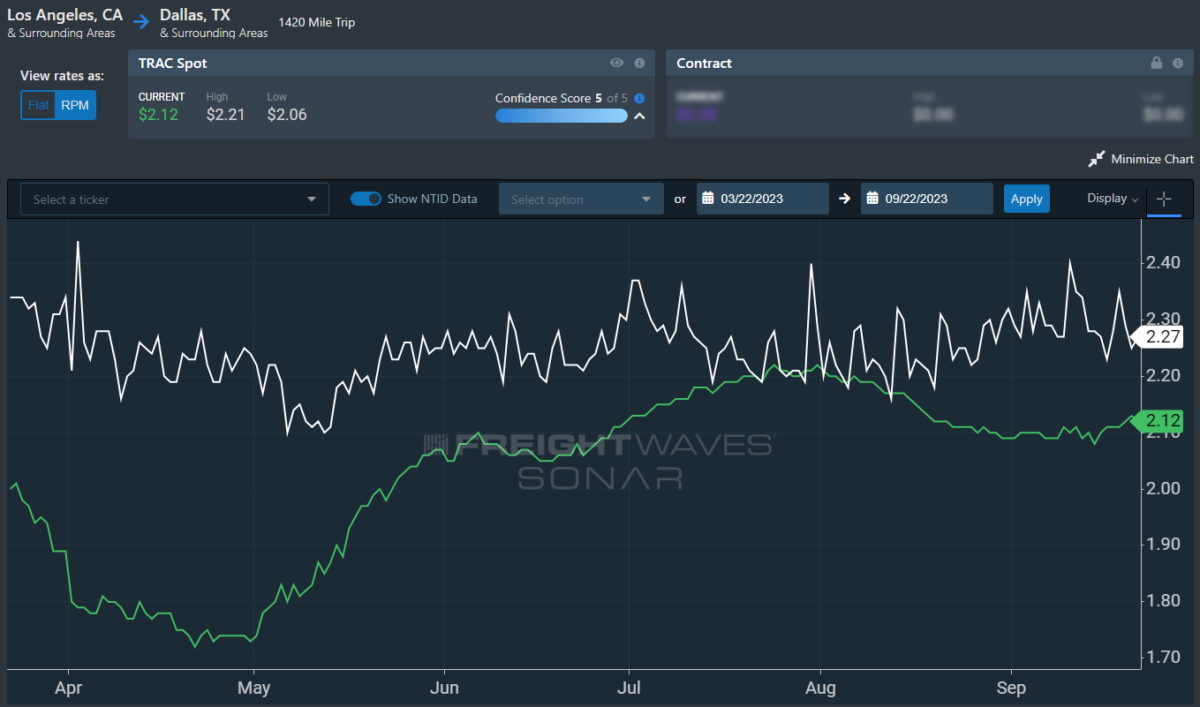
To learn more about FreightWaves TRAC, click here.
The FreightWaves Trusted Rate Assessment Consortium (TRAC) spot rate from Los Angeles to Dallas, arguably one of the densest freight lanes in the country, is struggling to regain its momentum. Over the past week, the TRAC rate rose 4 cents per mile to $2.12 — still some distance from its year-to-date high of $2.39. The daily NTI (NTID), which has fallen to $2.27, is handily outpacing rates along this lane.
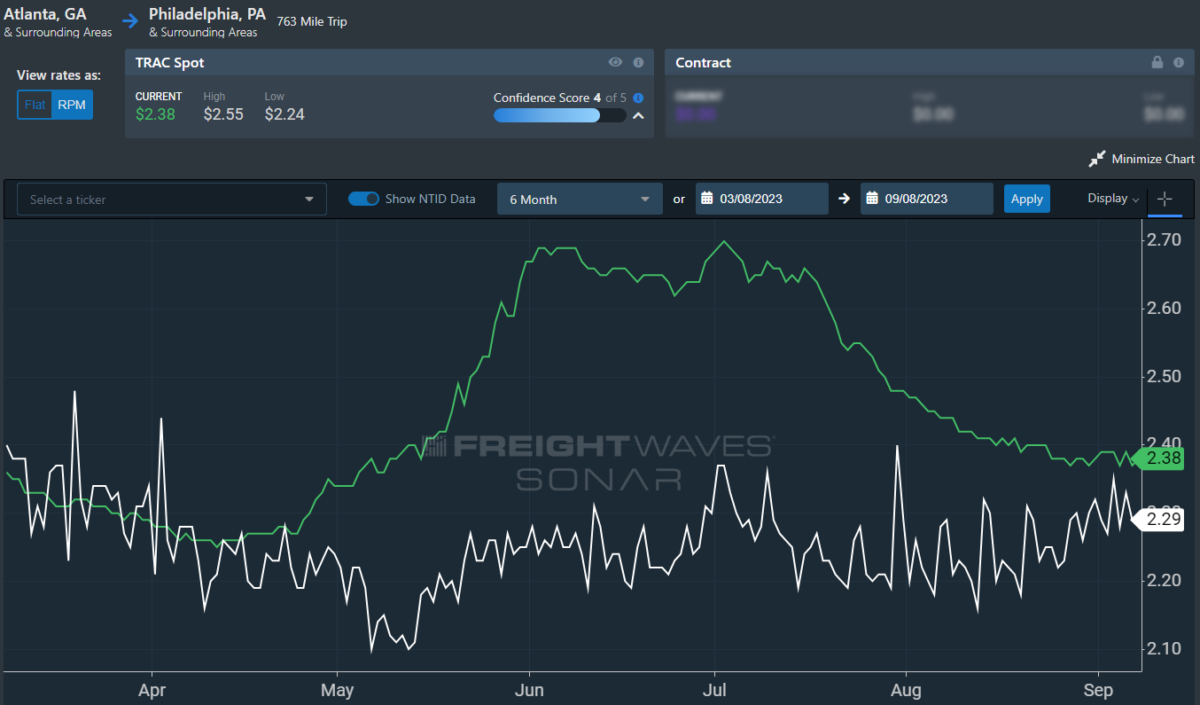
To learn more about FreightWaves TRAC, click here.
On the East Coast, especially out of Atlanta, rates have come down from July’s early peak but are still outpacing the NTID. The FreightWaves TRAC rate from Atlanta to Philadelphia fell 2 cents per mile to $2.37. After a bull run that started at the end of April, this lane had been plateauing above the national average, which made north-to-south lanes in the East far more attractive than West Coast alternatives.
For more information on FreightWaves’ research, please contact Michael Rudolph at mrudolph@freightwaves.com or Tony Mulvey at tmulvey@freightwaves.com.
The post Playing the waiting game appeared first on FreightWaves.
Source: freightwaves - Playing the waiting game
Editor: Michael Rudolph