Memorial Day might instead signal mayday
This week’s FreightWaves Supply Chain Pricing Power Index: 25 (Shippers)
Last week’s FreightWaves Supply Chain Pricing Power Index: 25 (Shippers)
Three-month FreightWaves Supply Chain Pricing Power Index Outlook: 30 (Shippers)
The FreightWaves Supply Chain Pricing Power Index uses the analytics and data in FreightWaves SONAR to analyze the market and estimate the negotiating power for rates between shippers and carriers.
This week’s Pricing Power Index is based on the following indicators:
Credit tightening won’t stop retailers
Volumes did see some growth ahead of the upcoming Memorial Day holiday, though not nearly enough to bust out the champagne and sparklers. With retail inventories still high — especially for big-ticket items like furniture that would otherwise fly off the shelves right now — there is no real urgency for retailers to move loads. That said, this weekend is a promising opportunity to finally burn off excess inventory that was accumulated over the past two years.
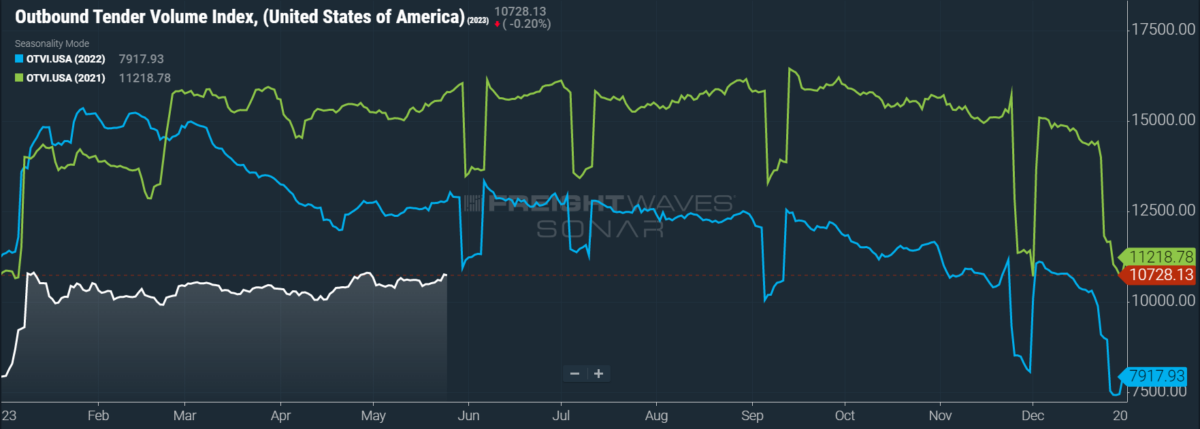
SONAR: OTVI.USA: 2023 (white), 2022 (blue) and 2021 (green)
To learn more about FreightWaves SONAR, click here.
This week, the Outbound Tender Volume Index (OTVI), which measures national freight demand by shippers’ requests for capacity, ticked up 2.28% on a week-over-week (w/w) basis. On a year-over-year (y/y) basis, OTVI is down 17.6%, yet such y/y comparisons can be colored by significant shifts in tender rejections. OTVI, which includes both accepted and rejected tenders, can be artificially inflated by an uptick in the Outbound Tender Reject Index (OTRI).
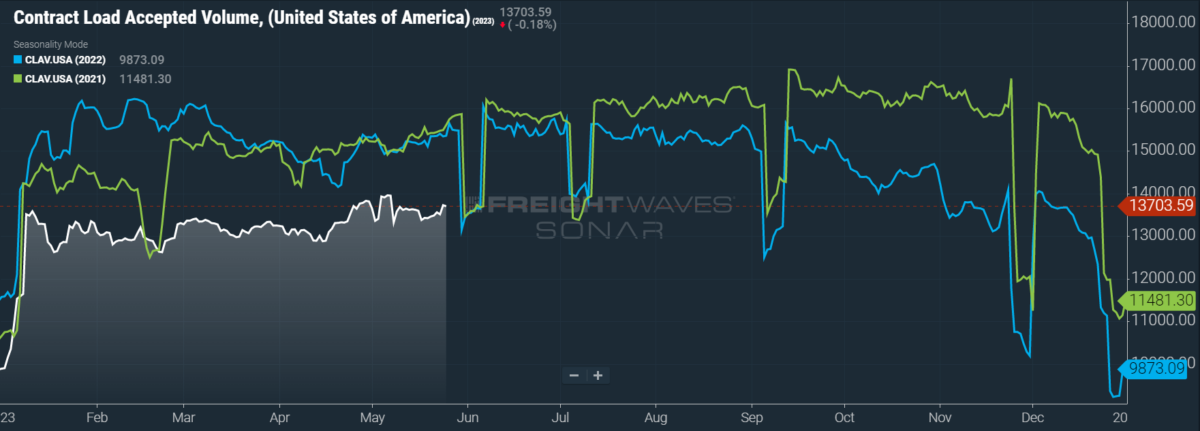
SONAR: CLAV.USA: 2023 (white), 2022 (blue) and 2021 (green)
To learn more about FreightWaves SONAR, click here.
Contract Load Accepted Volumes (CLAV) is an index that measures accepted load volumes moving under contracted agreements. In short, it is similar to OTVI but without the rejected tenders. Looking at accepted tender volumes, we see a gain of 2% w/w as well as a fall of 10.8% y/y. This y/y difference confirms that actual cracks in freight demand — and not merely OTRI’s y/y decline — are driving OTVI lower.
The Federal Open Market Committee (FOMC), which next meets in mid-June, had implied a shift in its philosophy behind the potential for future interest rate hikes. FOMC had previously been raising rates in response to hotter-than-desired inflation and a persistently robust labor market. Yet, as seen in its most recent meeting, rather than demand justification for a slowdown in rate hikes, FOMC now puts the burden of proof on its hawks.
Unfortunately, such hawks will be better equipped in June after the April release of the Personal Consumption Expenditures (PCE), which is FOMC’s preferred metric of inflation. Both the headline and core PCE — the latter of which excludes goods with volatile pricing like food and energy — rose 0.4% m/m against expectations of 0.3% y/y. Additionally, the personal savings rate in April was revised down from 4.5% to 4.1%. While data from this report might seem insignificant, it has convinced traders that FOMC is more likely to raise interest rates in June than to pause tightening. Of course, as interest rates rise, so too does the cost of borrowing money — whether for a house, a car or even groceries.
Whether monetary tightening will depress consumer spending during Memorial Day sales is something of an open question. Many midsized retailers of furniture, spending on which is historically strong during the holiday, are preparing to offer deeper discounts in 2023 than in previous years. Credit is also top of mind for such retailers, which are concocting creative financing options for consumers who might not qualify otherwise: Items with no down payment, interest-free financing, fewer credit checks and removing minimum purchase requirements for credit plans have all been proposed. Yet consumers, despite planning to celebrate Memorial Day with post-pandemic fervor, seem broadly uninterested in spending on freight-intensive durable goods. According to a survey by Numerator, food, beverages and party supplies are the categories expected to see the most spending growth.
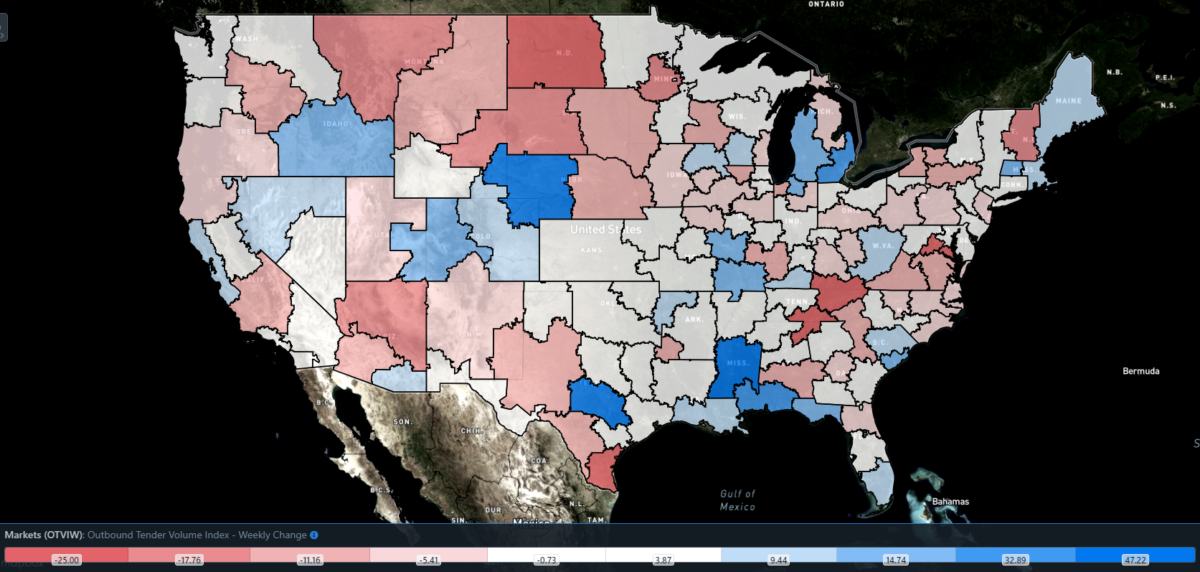
SONAR: Outbound Tender Volume Index – Weekly Change (OTVIW).
To learn more about FreightWaves SONAR, click here.
Of the 135 total markets, 75 reported weekly increases in tender volume, with most of the highest gains seen in smaller and midsized markets.
Despite being colored blue on the map above, Detroit was red-hot this week. The market’s OTVI rose 32.9% w/w, a signal of healthy industrial (particularly for auto manufacturing) activity in the region. But the average length of haul on loads coming out of Detroit is only 325 miles. Compared to other heavyweight markets like Atlanta (510 mi) and Ontario, California (750 mi), Detroit shipments fail to go the distance.
By mode: Reefers finally outperformed the overall OTVI this week, helped by the aforementioned Memorial Day demand for hot dogs, burgers and beer. The Reefer Outbound Tender Volume Index (ROTVI) ticked up 3.52% w/w. ROTVI is also up 1.46% y/y, which is doubly commendable as reefer rejection rates were nearly triple current levels at this time last year. The Van Outbound Tender Volume Index (VOTVI), on the other hand, is slightly underperforming against the overall OTVI without any clear consumer demand for furniture and other durable goods. VOTVI is up 2.22% w/w but down 20% y/y.
Flatbed markets are flatlining
After being goosed by last week’s International Roadcheck, it is little surprise that OTRI — which is a seven-day moving average — is still holding onto those gains. Next week, OTRI will likely rise in response to Monday’s celebration of Memorial Day, which muddies any current picture of whether pricing power is shifting in the market. Two weeks from now, then, will be an important test to see if carriers have already seen this cycle’s floor or not. Until then, those that choose to remain on the road can enjoy higher spot rates and less competition.
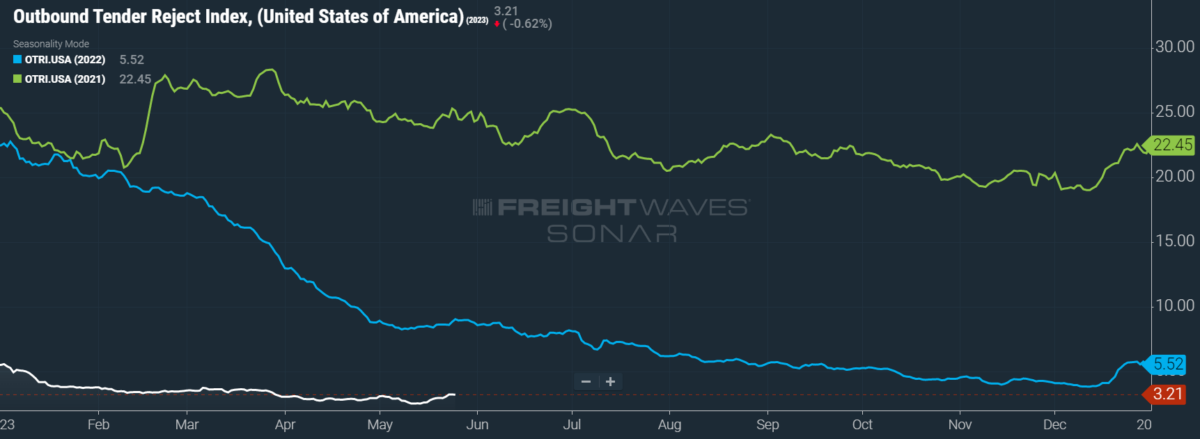
SONAR: OTRI.USA: 2023 (white), 2022 (blue) and 2021 (green)
To learn more about FreightWaves SONAR, click here.
Over the past week, OTRI, which measures relative capacity in the market, rose to 3.21%, a change of 32 basis points (bps) from the week prior. OTRI is now 583 bps below year-ago levels, with y/y comparisons becoming only more favorable as the year progresses.
The used truck bubble has well and truly popped. After peaking in April 2022 at $142,600 — a markup of nearly 100% y/y at the time — the average price of a 3-year-old used truck has plummeted back to earth. Last month, 3-year-old used trucks went for only $87,000, a decline of 39% y/y. With the supply chain crisis of semiconductors fading like a bad dream, truck manufacturers have opened up their order books to healthy demand, especially from enterprise fleets. The resupply of new trucks in the marketplace coupled with highly depreciated carrier rates has done most of the heavy lifting in bringing used truck prices down.
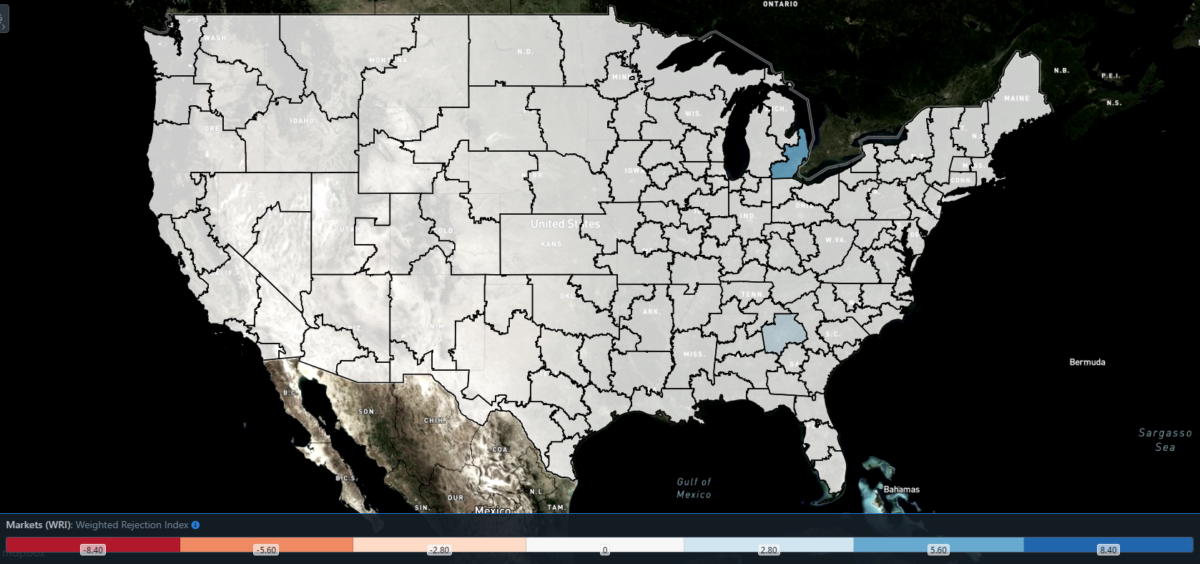
SONAR: WRI (color)
To learn more about FreightWaves SONAR, click here.
The map above shows the Weighted Rejection Index (WRI), the product of the Outbound Tender Reject Index — Weekly Change and Outbound Tender Market Share, as a way to prioritize rejection rate changes. As capacity is generally finding freight this week, a couple of regions posted blue markets, which are usually the ones to focus on.
Of the 135 markets, 99 reported higher rejection rates over the past week, though 64 of those saw increases of only 100 or fewer bps.
To learn more about FreightWaves SONAR, click here.
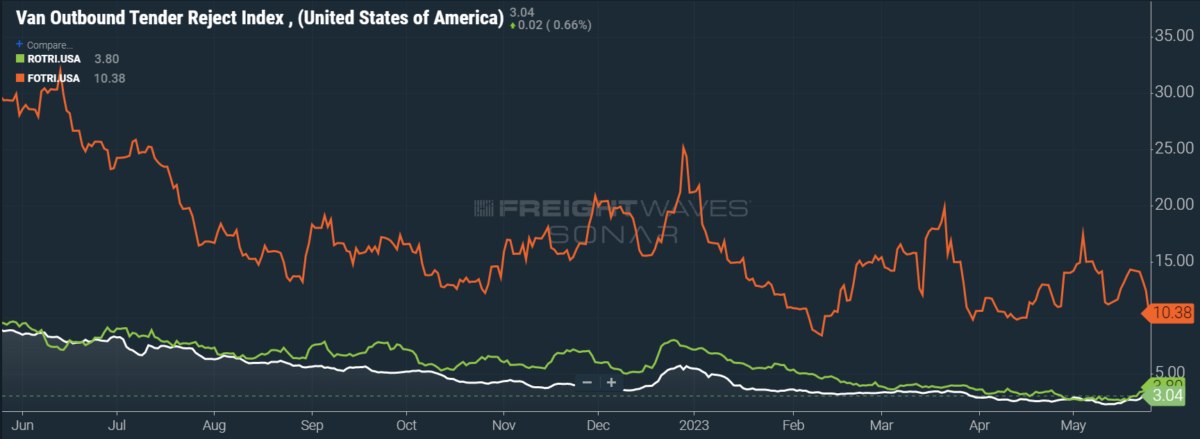
By mode: At a time when other modes are still reaping the benefits of last week’s International Roadcheck, flatbed rejection rates are already sliding from their most recent gains. To be sure, the Flatbed Outbound Tender Reject Index (FOTRI) is roughly quadruple that of its dry van and reefer counterparts, though its current slip is disconcerting nonetheless. FOTRI fell 339 bps w/w to 10.4%, once again nearing the single digits.
Vans and reefers, however, found some much-needed relief from recent lows. The Van Outbound Tender Reject Index (VOTRI) rose 36 bps w/w to 3.04%, while the Reefer Outbound Tender Reject Index (ROTRI) swelled by 112 bps w/w to 3.8%. Given that these two modes are far more consumer facing than flatbeds, it will be worth keeping an eye on these indexes over the next few weeks to see whether this reversal is the start of sustained growth or not.
Spot rates finally inspire confidence
While spot rates definitely benefited from some capacity going offline during last week’s International Roadcheck, they have impressively retained those gains in the run-up to Memorial Day. One might (rightly) ask why I just dismissed OTRI’s recent gains but am now celebrating those of spot rates. Despite being unsustainable for an entire cycle, OTRI could easily revert back to previous levels without helping the market into concrete slippers. After all, contract rates have been more stable than spot rates.
Yet spot rates had nearly fallen to 2019 levels — before even accounting for the 18% inflation rate between then and now, nor for the rising cost of diesel fuel, insurance and maintenance on aging fleets. If spot rates were not going to show any reversal soon, the worst fears of a carrier bloodbath would certainly be realized. Depending on how quickly spot rates recover, if they recover at all, we still might be headed for that nightmare scenario. But with recent spot rate gains, the future just got a little bit brighter.
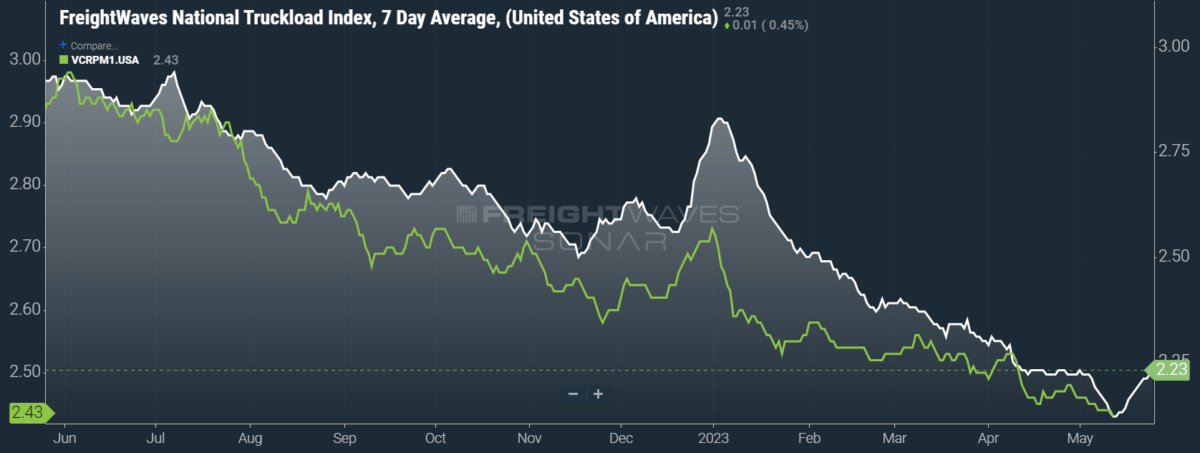
SONAR: National Truckload Index, 7-day average (white; right axis) and dry van contract rate (green; left axis).
To learn more about FreightWaves SONAR, click here.
This week, the National Truckload Index (NTI) — which includes fuel surcharges and other accessorials — rose 6 cents per mile to $2.23. Linehaul rates were the sole driver of gains this week, with price volatility of diesel fuel largely waiting for OPEC+’s next meeting to unfold. The linehaul variant of the NTI (NTIL) — which excludes fuel surcharges and other accessorials — also rose 6 cents per mile w/w to $1.60.
Contract rates, which exclude fuel surcharges and other accessorials like the NTIL, are showing greater weakness than expected. Given that contract rates are reported on a two-week delay, their most recent data comes from the dead center of the second quarter, normally a period when rate activity quiets. Yet contract rates fell 2 cents per mile w/w, hitting $2.43. This latest decline puts contract rates 12 cents per mile below Q1’s average of $2.55, for a decline of nearly 5%.
To learn more about FreightWaves SONAR, click here.
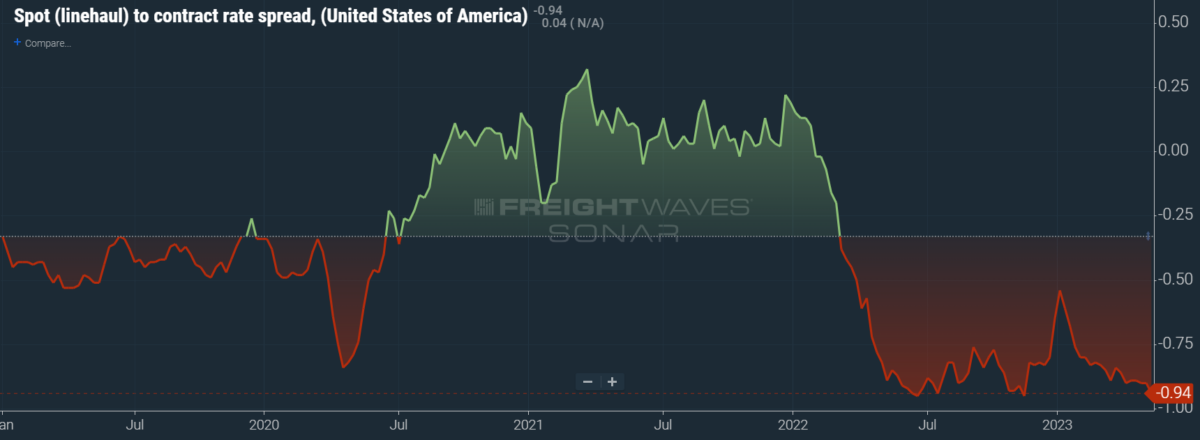
The chart above shows the spread between the NTIL and dry van contract rates, revealing the index has fallen to all-time lows in the data set, which dates to early 2019. Throughout that year, contract rates exceeded spot rates, leading to a record number of bankruptcies in the space. Once COVID-19 spread, spot rates reacted quickly, rising to record highs on a seemingly weekly basis, while contract rates slowly crept higher throughout 2021.
Despite this spread narrowing significantly over the first few weeks of the year, tightening by 20 cents per mile in January, it has continued to widen again. Since linehaul spot rates remain 94 cents below contract rates, there is still plenty of room for contract rates to decline — or for spot rates to rise — in the coming months.
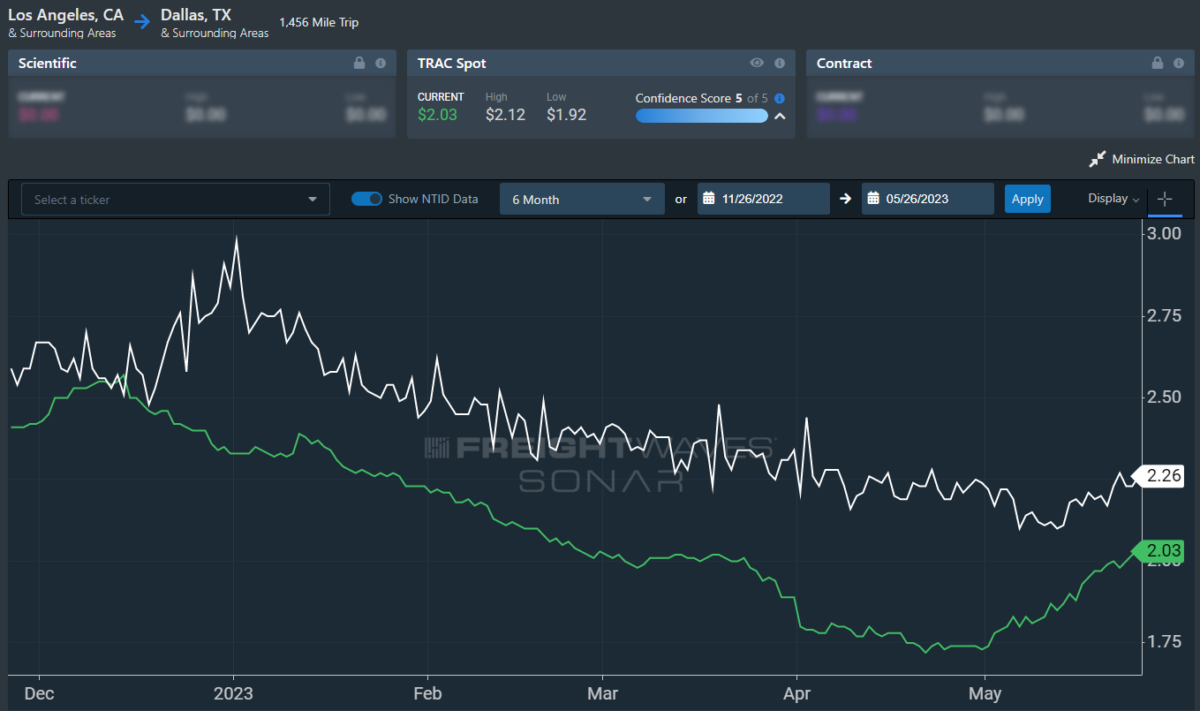
To learn more about FreightWaves TRAC, click here.
The FreightWaves TRAC spot rate from Los Angeles to Dallas, arguably one of the densest freight lanes in the country, continues to distance itself from April’s floor. Over the past week, the TRAC rate rose 6 cents per mile to $2.03 — a level still distant from its year-to-date high of $2.39. The daily NTI (NTID), which sits at $2.26, is handily outpacing rates from Los Angeles to Dallas.
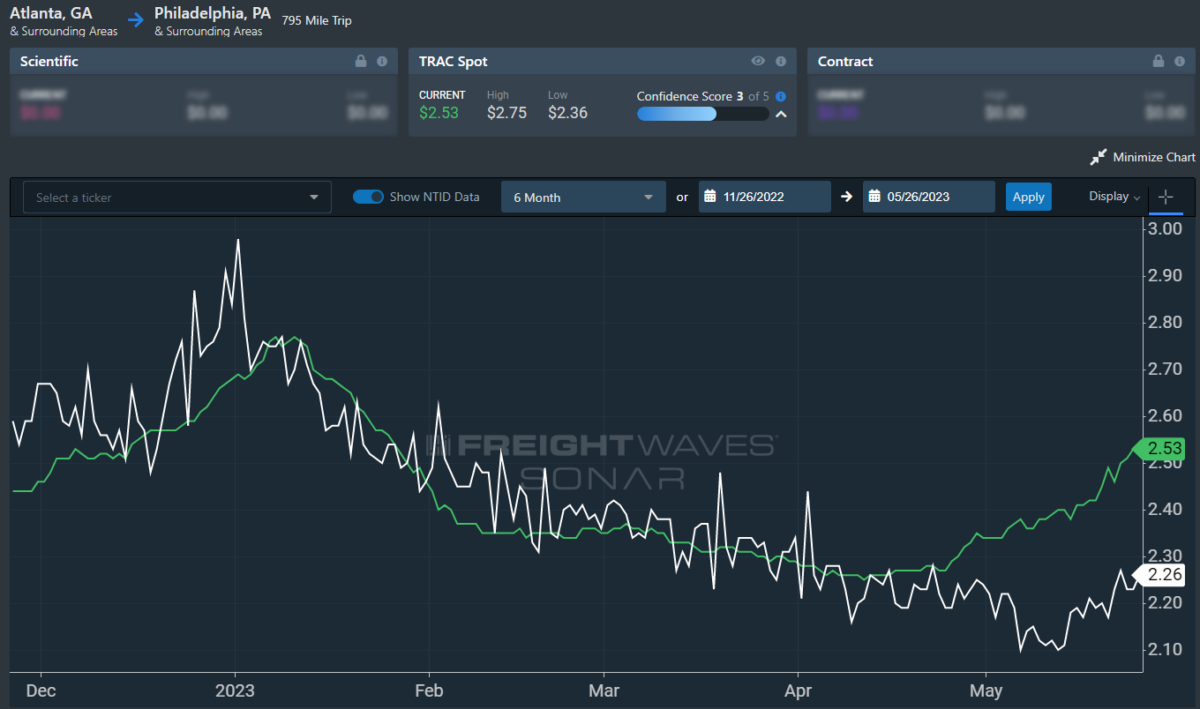
To learn more about FreightWaves TRAC, click here.
On the East Coast, especially out of Atlanta, rates rose and are outpacing the NTID. The FreightWaves TRAC rate from Atlanta to Philadelphia rose 11 cents per mile w/w to $2.53. A muted but sustained rally has been seen along this lane since April’s low of $2.27 per mile.
For more information on FreightWaves’ research, please contact Michael Rudolph at mrudolph@freightwaves.com or Tony Mulvey at tmulvey@freightwaves.com.
The post Memorial Day might instead signal mayday appeared first on FreightWaves.
Source: freightwaves - Memorial Day might instead signal mayday
Editor: Michael Rudolph