Freight News:
Loaded and Rolling: FMCSA outlines new driver detention study
FMCSA outlines new driver detention study

The Federal Motor Carrier Safety Administration on Wednesday released parameters on data collection for a new study to determine the impact of detention time on drivers. The Information Collection Request (ICR) was submitted to the Office of Management and Budget (OMB) for review and approval and opened the window for public comments. The request noted that approximately 80 carriers and 2,500 CMV drivers will provide data in the study. The data itself will come from a combination of ELDs, dispatch TMS systems and safety data over a period of 12 months.
FreightWaves’ John Gallagher wrote, “The ICR points out that while a 2014 FMCSA study provided ‘valuable insights’ on the effect of detention time on carrier and driver safety, it was limited, among other things, by a small sample size and the inability to separate legitimate time drivers spent loading and unloading from excess wait times.”
Detention time at origin and destinations remains a huge bottleneck for carriers as delays take away precious drive time and reduce revenue miles. Another major issue is the difficulty and costs associated with identifying and collecting detention time, as customers and brokers may invoke additional burdens to prove it occurred before paying. Currently, carriers bear the brunt and cost of supply chain inefficiencies, contributing to the higher turnover public for-hire trucking companies face compared to other segments in the supply chain.
Uber Freight research on truckload capacity

Mazen Danaf, an MIT-trained applied scientist and economist at Uber Freight, tackled the question of why there is a persistent and stubborn glut of truckload capacity, which continues to create depressed freight rates.
Typically higher costs and lower rates are the main culprit for capacity destruction, with Danaf telling FreightWaves, “Almost every mile driven in the spot market could be a losing mile. Even for large carriers who only go into the spot market 15% of the time, it doesn’t make sense except for a backhaul to a contract load.”
Danaf noted that while low rates and higher operating costs have put many owner-operators out of business, some of these drivers found work at larger carriers as employees or as an owner-operator running freight for that carrier’s internal freight network. Carrier migration between open spot markets and closed yet more predictable internal networks of larger carriers remains an opaque factor impacting the freight market.
Not only is driver supply remaining complicated, freight demand forecasts are equally challenging. FreightWaves’ JP Hampstead wrote, “The demand side of the market is similarly complex. There are reasons to think that the market may be picking back up: July saw super-seasonal volume growth in FreightWaves’ Outbound Tender Volume Index, and tender rejections, a measure of the balance of freight demand and truckload capacity, have been creeping back up, touching 3.95%.” One market to watch will be Southern California, often a harbinger to changes in truckload capacity nationwide if rejection rates continue to rise.
Market update: Headhaul Index highlights hot markets

The Headhaul Index (HAUL) is the difference between the Outbound Tender Volume Index (OTVI) and the Inbound Tender Volume Index (ITVI) and highlights the spread in loads leaving a market compared to loads arriving. For carriers and brokers making booking and pricing decisions, understanding the variance between inbound and outbound load volumes is helpful, as booking a load into a market with significantly fewer loads than trucks means a lower rate and more competition. The index is set where a negative reading has fewer loads outbound than inbound, while a positive value in blue shows more outbound loads than inbound.
The Los Angeles, Dallas, Chicago, Memphis, Tennessee, and Allentown, Pennsylvania, markets remain active, with LA leading the pack at 98.47 points. Los Angeles is experiencing greater activity through tender rejection rates at 5.42% and currently outperforms the nationwide average of 3.89%. But when deciding where to send drivers or solicit freight, the inbound rate to a market like Los Angeles will be lower than the outbound rate, as truckload supply competes and drives down rates searching for a more favorable market with more loads than trucks.
An example of an extreme backhaul market would be Lakeland, Florida, with a reading of minus 138.93 points. Due to so few outbound loads compared to inbound activity, rates moving into the Lakeland market will be higher than outbound loads, as competition from carriers desperate to find favorable freight volumes drives down rates.
FreightWaves SONAR spotlight: Spot rate forecast remains bullish on Labor Day bump
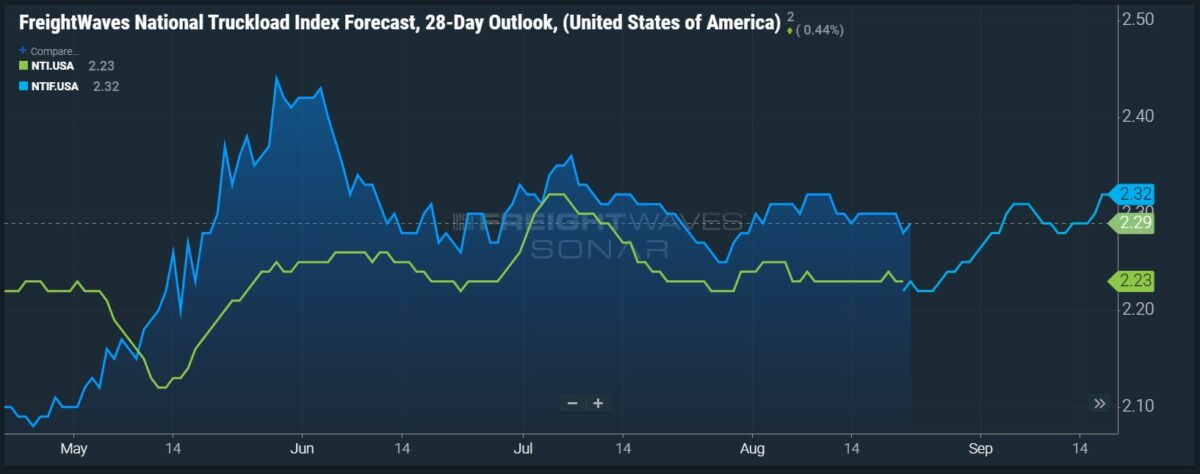
Summary: Forecast spot market rate expectations remain bullish for Labor Day gains as current spot market conditions remain flat in spite of weather disruptions from Hilary’s landfall earlier this week in California. Excess truckload capacity remains the primary hurdle for meaningful spot market gains and an answer to whether the freight market downcycle has reached its trough. Spot market rates over the next 28 days are forecast to rise 9 cents per mile all-in, or 4.04%, from $2.23 per mile to $2.32 per mile on Sept. 19, according to the FreightWaves National Truckload Index Forecast, 28-Day Outlook (NTIF28).
When removing a fuel surcharge from the equation, spot market linehaul rates (NTIL) remained relatively flat week over week (w/w), falling 1 cent per mile from $1.57 per mile on Aug. 14 to $1.56 per mile. Sluggish spot market performance can be explained by carriers exposed to contracted freight having excess capacity and routing guides soaking up extra freight before being tendered to the spot market.
Outbound tender rejection rates rose only 41 basis points w/w from 3.54% on Aug. 14 to 3.95%, well below rates of 5% to 7%, where contracted truckload capacity begins to struggle to cover excess truckload demand and excess truckload orders matriculate down the routing guide before finding their way into the spot market. One factor to watch will be the impact of tropical activity during the peak of the Atlantic hurricane season and if landfalls have a major disruption on transportation and freight networks, which could cause a weather-related bump to outbound tender rejection and spot market rates.
The Routing Guide: Links from around the web
Werner’s appeal of $100M Texas verdict focuses on legal arguments (FreightWaves)
76,600 U.S. bridges need to be replaced; 42,400 are in poor condition (Trucker News)
CARB sets up unit to help fleets navigate California’s Clean Fleets rule (FreightWaves)
Trailer build rates remain strong in the face of economic headwinds (Commercial Carrier Journal)
Smaller US truckers forced out as haulage spot market hits ‘critical point’ (The Load Star)
Teamsters overwhelmingly ratify UPS contract (FreightWaves)
Like the content? Subscribe to the newsletter here.
The post Loaded and Rolling: FMCSA outlines new driver detention study appeared first on FreightWaves.
Source: freightwaves - Loaded and Rolling: FMCSA outlines new driver detention study
Editor: Thomas Wasson