Freight News:
Knight-Swift resets expectations for 2023 after rough Q1
The nation’s largest truckload carrier, Knight-Swift Transportation, missed first-quarter expectations and significantly reeled in its 2023 earnings outlook.
Full-year earnings per share are now forecast in a range of $3.35 to $3.55, 16% lower than the guidance provided just a quarter ago (calculated at the midpoint). The new guide sits 40 cents below the consensus estimate at the time of the print.
“I think it’s been 20 years since we’ve seen such a prolonged deficit of imports on the West Coast,” President and CEO Dave Jackson told analysts on a conference call Thursday after the market closed. “It’s hard to imagine that we would see a repeat as difficult on imports for a consecutive quarter in the second as we saw in the first.”
Similar conditions were cited Monday by J.B. Hunt Transport Services (NASDAQ: JBHT), which also has large exposure to the West Coast ports. Loaded inbound containers to major U.S. ports were down roughly 30% year over year (y/y) in February and March.
Jackson said the company didn’t see the normal seasonal uptick in demand during March and that the lackluster trends have carried into April.
While the new guidance breaches the $4 EPS floor that management previously pointed to, and many analysts baked into their assumptions, Jackson was quick to point out that the revised expectation is still 60% higher than the last trough.
“We’re trying to make sure that as we go from cycle to cycle that the collar of the high and the low continue to increase. Surely, that is what we have seen happen now for the last few cycles,” Jackson said. “We’re well on our way to set ourselves up to continue to do that for the next cycle.”
However, the guidance does not include any impact from the pending acquisition of TL carrier U.S. Xpress (NYSE: USX). That company has been operating at a loss and will likely require some heavy lifting on the integration front, which could further hinder Knight-Swift’s results.
Q1 provided some noise, reset the bar
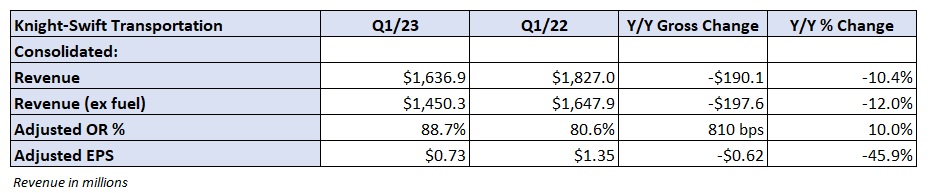
Knight-Swift (NYSE: KNX) reported adjusted earnings per share of 73 cents in the first quarter, 8 cents below the consensus estimate and well off the $1.35 mark reported a year ago. There were several headwinds, which negatively impacted the quarter.
The company saw an 11-cent-per-share hit from its third-party insurance program, which provides coverage to small carriers. Unfavorable claims development and difficulty collecting premiums were the culprits. Knight-Swift itself saw prior-year claims settle higher than expected, which was a 4-cent drag.
Gains on equipment sales were nearly $14 million lower y/y (7 cents per share), and the company saw a 3.5x increase in interest expense (8 cents per share) even as total debt was reduced.
The TL and logistics units accounted for most of the decline in operating income during the quarter.
Revenue in the TL segment was down 8% y/y to $866 million as miles per tractor fell 3% and revenue per loaded mile (excluding fuel) was down 6%. The segment posted an 86.6% operating ratio, 840 basis points worse y/y.

The quarter was up against a tough comp from a year ago when contract volumes and rates were still reflective of a peak.
Management expects spot rates to remain below contract rates through the first half of the year and said the company has already renegotiated bids with 70% of its customers. Revenue per mile is expected to fall in the high-single-digit range y/y in 2023 versus the prior expectation of a mid-single-digit decline. Management noted the toughest y/y comparison is in the second quarter and that it expects flattish y/y comps by the fourth quarter.
“We are arguably into our fifth consecutive quarter of steeply negative spot rates with unrelenting inflationary costs,” Jackson said. “We’re going to need to see another quarter or two and see where we go.”
Jackson said he expects several carriers to exit the industry, which would reduce capacity and alleviate pricing pressures.

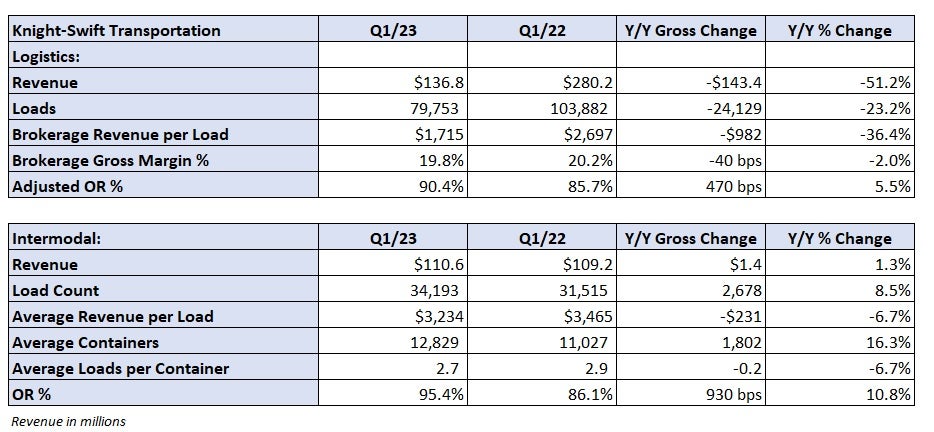
Revenue in the logistics segment was cut in half to $137 million as loads fell 23% y/y and revenue per load was down 36%. Gross margin was off only slightly, but cost reductions didn’t keep pace with lower revenue as the OR deteriorated 470 bps to 90.4%.
The logistics unit is now expected to see volume and revenue per load headwinds persist through the second quarter. The segment is expected to post a low-90% OR for the year. The prior call was sequential improvement after the first quarter with a high-80s to low-90s OR for the full year.
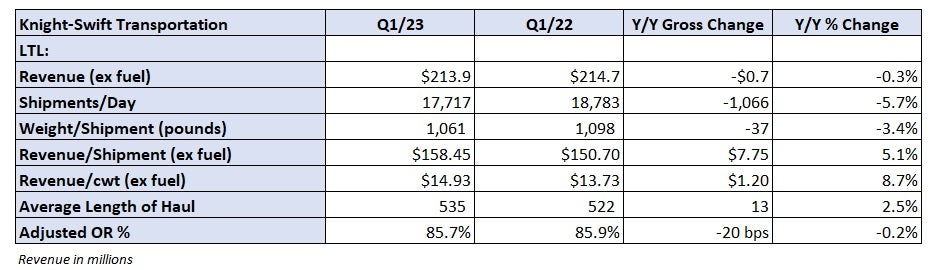
The lone bright spot was the company’s less-than-truckload segment. Shipments per day were off 6% y/y with weight per shipment down 3%. However, a 9% increase in yields (excluding fuel) produced essentially flat revenue compared to the year-ago period. The unit saw 20 bps of OR improvement to 85.7%.
Management said LTL trends were off to a good start in April with yields continuing to move higher.
The company’s nonreportable segments, which include the aforementioned third-party insurance program, saw a $27 million y/y operating income reversal, posting a loss of $15.6 million.
Knight-Swift put the brakes on providing insurance to small carriers as a loose truck market is weighing on rates, exacerbating cost inflation. The current risk profile of owner-operators is much worse than what was previously underwritten, management said.
Some favorable tailwinds to guidance were provided.
Gains on sale are looking up and will now likely between $15 million and $20 million per quarter (up $5 million at both ends of the range). Most of the equipment that Knight-Swift is selling is going to smaller fleets that can’t afford new equipment prices but still need to reduce average fleet ages.
Management also said labor and recruiting expenses should step down as drivers have migrated back to the large fleets, which can provide some level of income security in a downturn. Utilization, or miles per tractor, are expected to increase y/y in the back half.
“Not dramatic moves from where we are but some small sequential improvements as we progress through the year,” CFO Adam Miller said.
More FreightWaves articles by Todd Maiden
- XPO adds another Old Dominion veteran to roster
- Prologis says ‘market is going to tighten up again’
- ‘Freight recession’ snares J.B. Hunt in Q1
Capacity Trend maps can help you find the tightest markets
videojs.getPlayer('1763702711707954276').ready(function() {
var myPlayer = this;
myPlayer.on("loadedmetadata", function() {
var browser_language, track_language, audioTracks;
browser_language = navigator.language || navigator.userLanguage; // IE <= 10
browser_language = browser_language.substr(0, 2);
audioTracks = myPlayer.audioTracks();
for (var i = 0; i < audioTracks.length; i++) {
track_language = audioTracks[i].language.substr(0, 2);
if (track_language) {
if (track_language === browser_language) {
audioTracks[i].enabled = true;
}
}
}
});
});
The post Knight-Swift resets expectations for 2023 after rough Q1 appeared first on FreightWaves.
Source: freightwaves - Knight-Swift resets expectations for 2023 after rough Q1
Editor: Todd Maiden