Freight News:
J.B. Hunt still working through bottom of cycle
J.B. Hunt Transport Services told analysts Tuesday night it’s still too early to say how the 2023 peak shipping season will shape up.
The company reported second-quarter earnings per share of $1.81 after the market closed, 11 cents light of the consensus expectation and 61 cents worse year over year (y/y). A 100-basis-point increase in the tax rate to 26% was a 2-cent headwind compared to last year while a $7 million swing in the sale of equipment was a 5-cent impact.

Operating income per load in the intermodal segment fell again in the quarter, down 24% y/y to $284. The segment saw revenue fall 19% as loads fell 7% and revenue per load was down 13% (7% lower excluding fuel surcharges). Management said roughly 70% of renewed contract pricing had been implemented by the end of the second quarter.
J.B. Hunt’s (NASDAQ: JBHT) intermodal volumes outpaced the broader industry as traffic on the U.S. Class I railroads was down 10% y/y, according to the Association of American Railroads. The company’s volume comps get easier moving forward.
Intermodal volumes fell y/y by 9% in April, 8% in May and only 4% in June. Further, the June comp was the toughest from 2022 (up 10% y/y) reflecting an improvement in the two-year volume comps as the quarter progressed. Intermodal loads were 3% higher sequentially from the first quarter but revenue was down by a similar percentage, a rarity as the first quarter of each year is often the demand low point.
“We saw evidence from customers in June that the destocking has moderated,” said Darren Field, president of intermodal, on the analyst call. He said customers previously had indicated volume would return once a labor deal on the West Coast was reached, but noted there hasn’t been a real demand influx yet.
“We’re still in a wait-and-see mode for the rest of the year,” Field concluded.
Roughly 18% of the company’s intermodal container fleet was idle in the quarter given weaker demand and recent capacity additions. The unit reported a 90.4% operating ratio.

Brokerage revenue fell 43% y/y to $344 million as loads were down 26% and revenue per load fell 24%. The segment’s gross profit margin dropped 310 bps to 13%. Contractual volumes were 66% of the total compared to 44% last year. The unit booked an operating loss of $4.4 million.

Dedicated revenue was down just 2% y/y to $888 million as revenue per truck per week declined 4% (up 3% excluding fuel) due to a similar decline in load counts. Management said the sales pipeline remains consistent and that volumes have largely held steady. The unit reported its highest-ever operating income for any period at $114 million (87.2% OR) as efficiency gains have been realized in the operation of previously onboarded accounts.

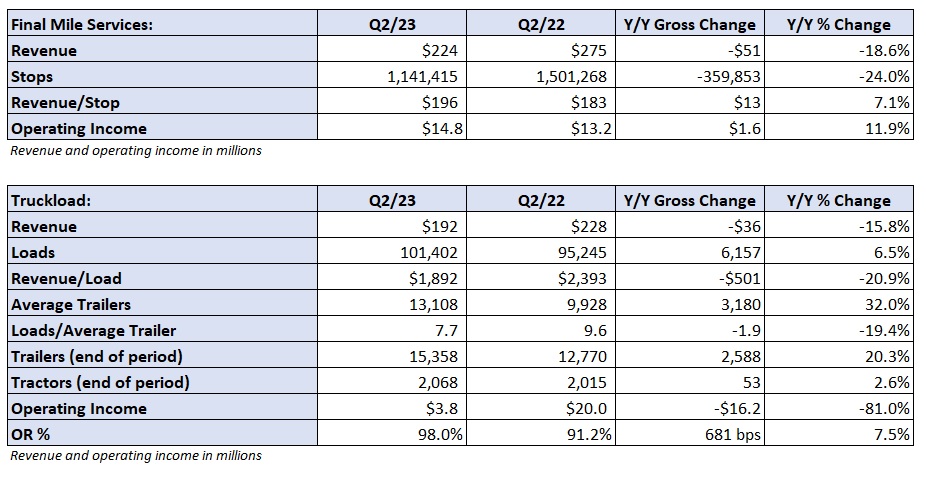
The company’s asset-light truckload segment saw just under $4 million in operating income on $192 million in revenue (98% OR). Revenue fell 16% y/y as loads increased 7% and revenue per load fell 21%. Utilization, or average loads per trailer, fell 19% to 7.7 in the quarter.
More FreightWaves articles by Todd Maiden
- Yellow says it’s not paying even as potential strike looms
- Prologis beats Q2 expectations, lowers rent growth forecast
- Strike risk rises as Yellow punts on more than $50M in required contributions
The post J.B. Hunt still working through bottom of cycle appeared first on FreightWaves.
Source: freightwaves - J.B. Hunt still working through bottom of cycle
Editor: Todd Maiden