Freight News:
Import demand dip hasn’t fully manifested but is sign of things to come

Companies are ordering less goods, which should not be a surprise
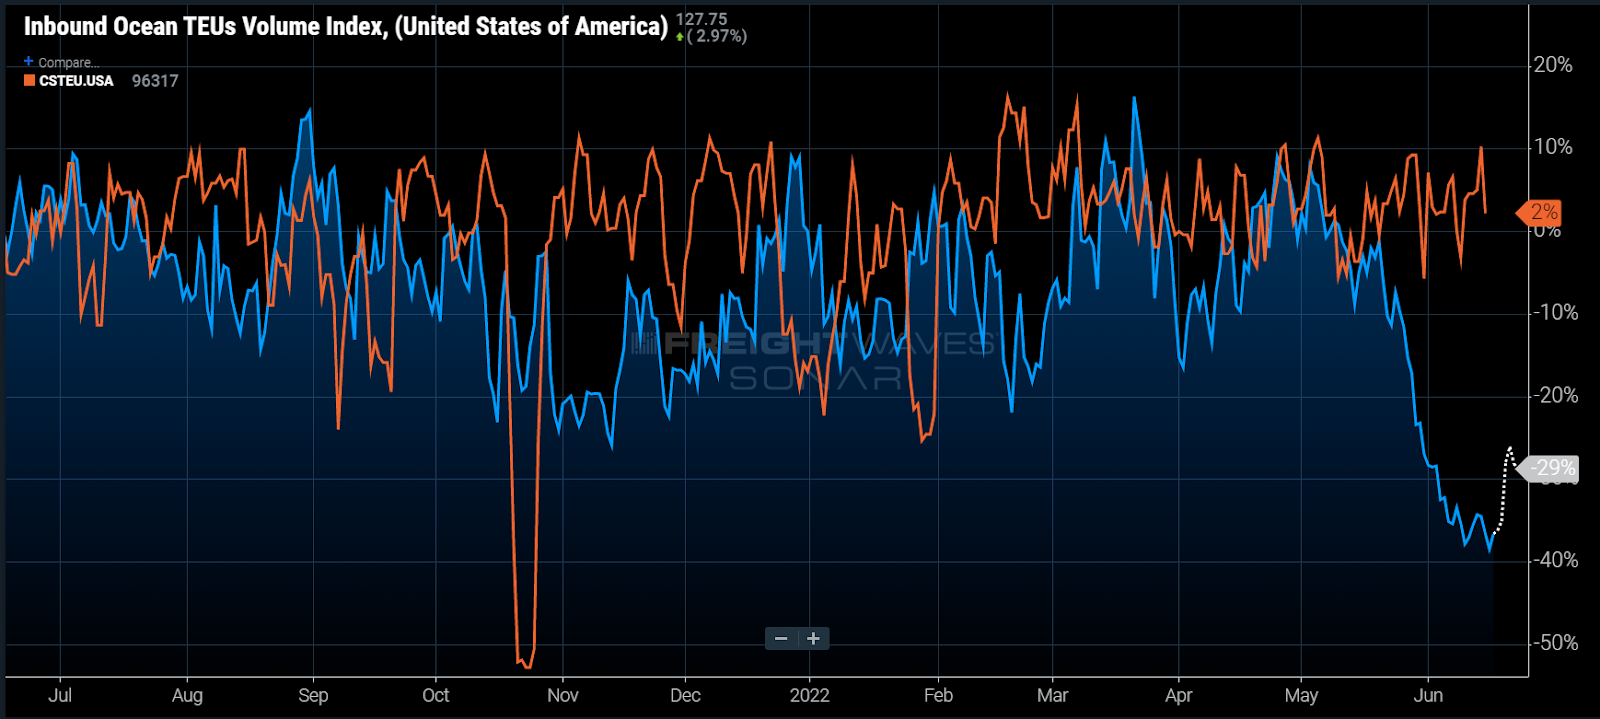
Chart of the Week: Inbound Ocean TEU Index, US Customs Maritime Imports TEUs – USA SONAR: IOTI.USA, CSTEU.USA
The 36% drop in import volumes reported earlier this month has not materialized domestically yet and may not for several months, depending on your place in the supply chain. The Inbound Ocean TEUs Volume Index (IOTI) measures trends in TEU volumes that companies book by departure date from their ports of origin. With an average reported transit time of roughly 26.5 days, the ports will not feel the full impact of this until the middle of July and downstream providers will be even later.
Earlier this week, investment firm Stifel circulated a report that disputed the drop in import volumes, citing customs data as its main point of refutation. This is a clear misunderstanding of the data and needs to be addressed.
This week’s chart includes customs data (CSTEU) and an updated IOTI, which was the premise of the “dropping of a cliff” article on June 7. Customs data shows a 2% annual increase while the bookings data continues to show a 30% dip. The point is that the IOTI leads customs data by nearly a month at this point and is not sufficient to refute the decline in orders.

There is already sufficient evidence both in data and in company reports to support declining orders. Inventories have grown at record levels since February. Trucking demand has already experienced a sharp decline, causing spot rates to fall 19% since January. The S&P 500 has dropped 20% over the past six months.
Consumers are spending more on services. Inflation is still not under control and has inspired the Fed to increase interest rates faster than it had in 28 years. Companies like Target have reported inventory gluts that will lead to greater discounts in the second half of the year.
To put it simply, the goods economy is cooling from an unsustainable level of activity and it should not be a surprise. The debate should not be whether or not companies are ordering less, but what exactly does this dip mean economically and for supply chains and transportation?
The drop in ordering still does not bring the IOTI all the way back to pre-pandemic levels. The index averaged 104 throughout 2019. As of Thursday, it is showing a value of 127, indicating that companies are still ordering 22% more than they were three years ago.
This suggests that we still have further to fall potentially and we have probably crested the peak of the current goods demand cycle. Inflation and increasing interest rates have long-term implications and will tamp down demand into 2023.
The takeaway for supply chain managers is that they should expect to see improving conditions, at least from the transportation capacity side. Inventory and warehouse management will likely be a problem into the future as demand forecasting will still be a challenge while the U.S. is in economic transition. Forecasts should certainly be revised much lower than where they were to start the year.
Truckload carriers that operate outside of the ports may have already felt the brunt of the impact of waning demand. They are positioned largely downstream in the supply chain and get more active as retail demand increases and service becomes more important. They have probably not experienced the bottom, however, as the import orders suggest this is just the front edge of the decline. Carriers, especially retail-heavy ones, should expect a much softer 2H 2022 than 2021.

The rails are benefiting from the backlog of containers and rates are averaging around a 13% discount to trucking as of late May, according to the Intermodal Contract Savings Index (IMSCI1). Once the backlogs clear, they will inevitably see a strong decline in container volumes.
The dip in bookings is an indication of things to come. It will take 30 days to manifest for the ports and probably a little longer for the surface transportation providers. Inventory management strategies are shifting away from just in case to shorter and more focused ones. While it does not necessarily mean economic recession, it does mean at the very least goods demand is waning.
About the Chart of the Week
The FreightWaves Chart of the Week is a chart selection from SONAR that provides an interesting data point to describe the state of the freight markets. A chart is chosen from thousands of potential charts on SONAR to help participants visualize the freight market in real time. Each week a Market Expert will post a chart, along with commentary, live on the front page. After that, the Chart of the Week will be archived on FreightWaves.com for future reference.
SONAR aggregates data from hundreds of sources, presenting the data in charts and maps and providing commentary on what freight market experts want to know about the industry in real time.
The FreightWaves data science and product teams are releasing new datasets each week and enhancing the client experience.
To request a SONAR demo, click here.
Source: freightwaves - Import demand dip hasn’t fully manifested but is sign of things to come
Editor: Zach Strickland, FW Market Expert & Market Analyst