Freight News:
Freight outlook for January is grim but seasonal
This week’s FreightWaves Supply Chain Pricing Power Index: 35 (Shippers)
Last week’s FreightWaves Supply Chain Pricing Power Index: 35 (Shippers)
Three-month FreightWaves Supply Chain Pricing Power Index Outlook: 30 (Shippers)
The FreightWaves Supply Chain Pricing Power Index uses the analytics and data in FreightWaves SONAR to analyze the market and estimate the negotiating power for rates between shippers and carriers.
This week’s Pricing Power Index is based on the following indicators:
Volumes’ weekly gains are helped by easy comps
Volumes have continued their recovery from the winter holiday season with a surge in pent-up freight demand unleashed into the market. Naturally, since last week’s data was affected by holiday noise, the Outbound Tender Volume Index (OTVI) faces some absurdly easy comps on a weekly basis. Even still, accepted tender volumes remain below their levels of 2021 and ’22 for the time being.
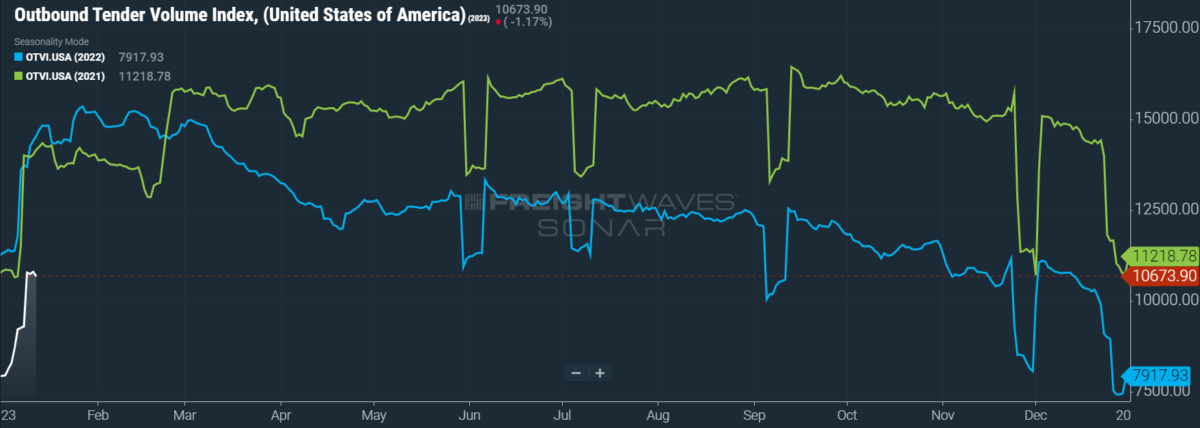
SONAR: OTVI.USA: 2023 (white), 2022 (blue) and 2021 (green)
To learn more about FreightWaves SONAR, click here.
To reiterate, OTVI’s movements on a week-over-week (w/w) basis will not be terribly informative right now, since many shippers and carriers were observing New Year’s Day last Monday. Nevertheless, OTVI did rise 22.83% w/w. On a year-over-year (y/y) basis, OTVI is down 27.6%, though such y/y comparisons can be colored by significant shifts in tender rejections. OTVI, which includes both accepted and rejected tenders, can be artificially inflated by an uptick in the Outbound Tender Reject Index (OTRI).
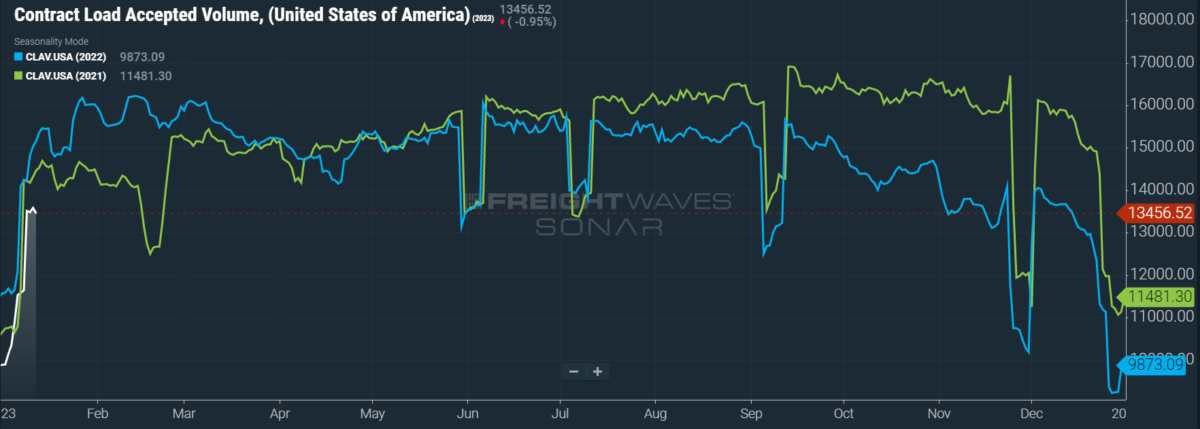
SONAR: CLAV.USA: 2023 (white), 2022 (blue) and 2021 (green)
To learn more about FreightWaves SONAR, click here.
Contract Load Accepted Volumes (CLAV) is an index that measures accepted load volumes moving under contracted agreements. In short, it is similar to OTVI but without the rejected tenders. Looking at accepted tender volumes, we see a rise of 23% w/w as well as a fall of 11% y/y. While this y/y difference does confirm that actual cracks in freight demand — and not merely OTRI’s y/y decline — are driving OTVI lower, it is worth noting that Q1 2022 was an unusually active season for shippers, which thus makes for unfair comps. At the start of 2022, shippers were just beginning to account for the unforeseen volatility of truckload markets and were eager to secure capacity during the traditionally quiet season of Q1.
Per a recent release by the National Retail Federation (NRF), the “pandemic-driven surge [is] finally over.” The NRF came to this conclusion by looking at U.S. import volumes, which are expected to remain at pre-pandemic levels for both this month and the next. Adding to the dearth of import volumes will be the upcoming Lunar New Year, during which Chinese manufacturing and export facilities will be closed over the 15-day celebration. That pause should allow container ports to clear out any remaining congestion, of which there is little. Strikingly, the ports of Houston and Savannah, Georgia — which, in 2022, saw demand greatly outstrip their facilities’ capacity — have few ships lingering in their queues.
While I personally expect that consumer demand for imported goods will not make a sudden resurgence any time soon, there is a justified fear that shippers are once again overreacting to market conditions. In 2021, of course, shippers were unable to handle the “pandemic-driven surge” of consumer demand and thus fell victim to the bullwhip effect. But now, it can be argued that shippers with low inventories will be caught unawares when consumer demand rises in response to easing inflation.
To this argument’s credit, the December release of the consumer price index (CPI) showed that inflation slowed for the sixth consecutive month after a peak of 9.1% y/y in June 2022. December’s CPI was up a relatively modest 6.5% y/y, while the core CPI — which excludes items with volatile pricing like food and gasoline — rose 5.7% y/y. This current data could convince the Federal Reserve either to continue decelerating its interest rate hikes or, more dramatically, to hold interest rates at their current level.
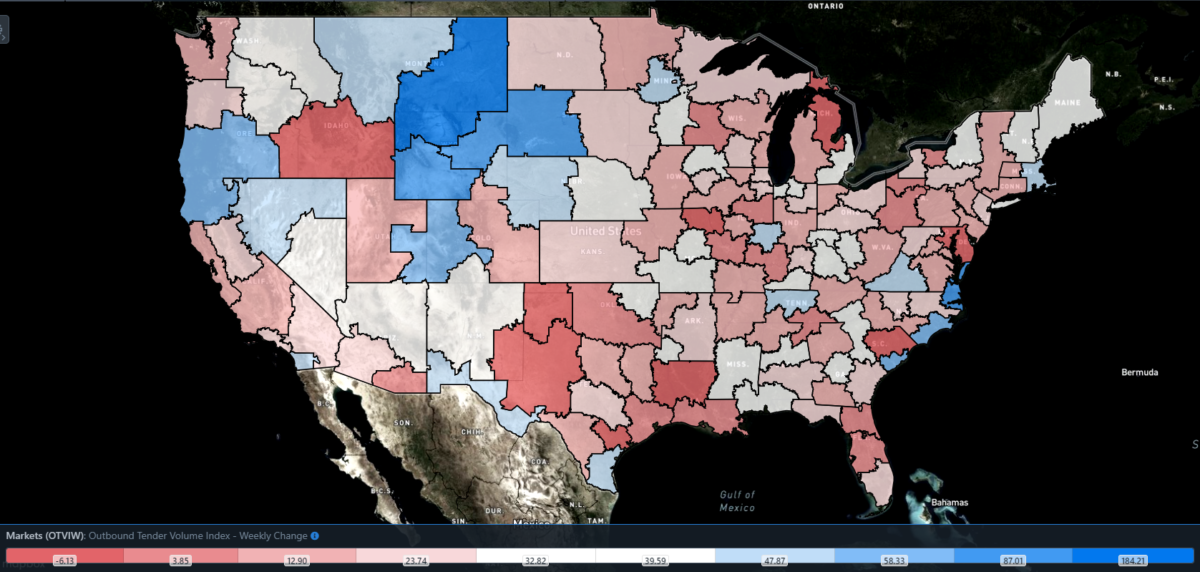
SONAR: Outbound Tender Volume Index – Weekly Change (OTVIW).
To learn more about FreightWaves SONAR, click here.
Of the 135 total markets, all but five reported weekly increases in tender volume as truckload markets shook off their last vestiges of holiday blues.
Since every market faces easy comps this week, it is worth looking at those in which the local OTVI underperformed against the national index. Houston is unfortunately the biggest culprit of this weakness. Despite being the nation’s fourth-largest market by outbound volume, freight demand rose only a scant 5.56% w/w. As of Friday at 9 a.m. EST, only four container ships are anchored off the coast of Houston — a far cry from last summer’s consistent queues of 20-plus ships.
By mode: Van volumes are the key driver behind the national OTVI’s rebound from the holidays. The Van Outbound Tender Volume Index (VOTVI) is up 26% w/w. While VOTVI is down against yearly comps in almost equal measure, falling 26.7% y/y, much of this difference can be attributed to the gap in van rejection rates between 2023 and ’22. Accepted van volumes are nevertheless down 11.1% y/y.
Reefer volumes are nearly the mirror opposite, since the Reefer Outbound Tender Volume Index (ROTVI) is only up 13.4% w/w. Again, ROTVI is down 33.6% y/y, but the gap between reefer’s rejection rates in 2023 and ’22 is much wider than that of van’s. Accepted reefer volumes are actually up by a slight, though still impressive, 2.2% y/y.
Tender rejections slip closer to pre-Christmas levels
Although OTRI’s movements over the past three to six months look fairly drastic, I shouldn’t give into sensationalism. In reality, OTRI budged fewer than 200 basis points from trough to peak in December. In the broader context of the full data set, such activity is relatively insignificant. With that caveat in mind, OTRI is hastily burning through its seasonal gains, revealing the weakness of carriers’ current leverage in the market.
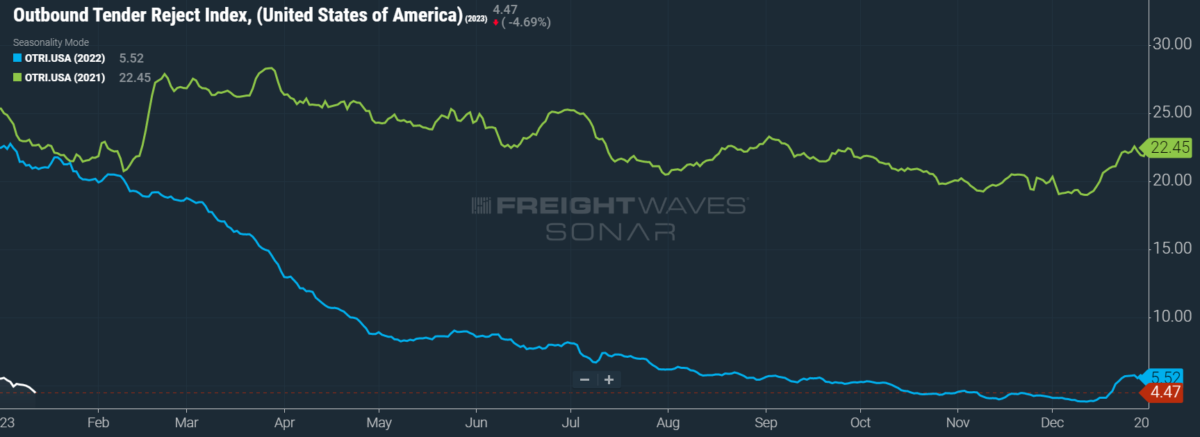
SONAR: OTRI.USA: 2023 (white), 2022 (blue) and 2021 (green)
To learn more about FreightWaves SONAR, click here.
Over the past week, OTRI, which measures relative capacity in the market, fell 47 bps to 4.47%. OTRI is now 1,656 bps below year-ago levels.
In the first session of the new Congress, a team of 20 Republican lawmakers banded together to reintroduce an exemption for underage drayage truckers. Rep. Brian Mast of Florida, who spearheaded a similar bill in 2021 that failed to see the floor, is championing the Ceasing Age-Based (CAB) Trucking Restrictions Act, a proposal to allow CDL holders as young as 18 to haul containers to and from marine terminals. Under the current law, moving containers and other cargo from seaports is considered interstate trucking, even if the cargo’s final destination is located within the same state as the port itself. Given the aforementioned evidence that congestion at U.S. ports is all but eliminated, the present purpose of Mast’s bill is unclear, though it could find significance in future deluges of import activity.
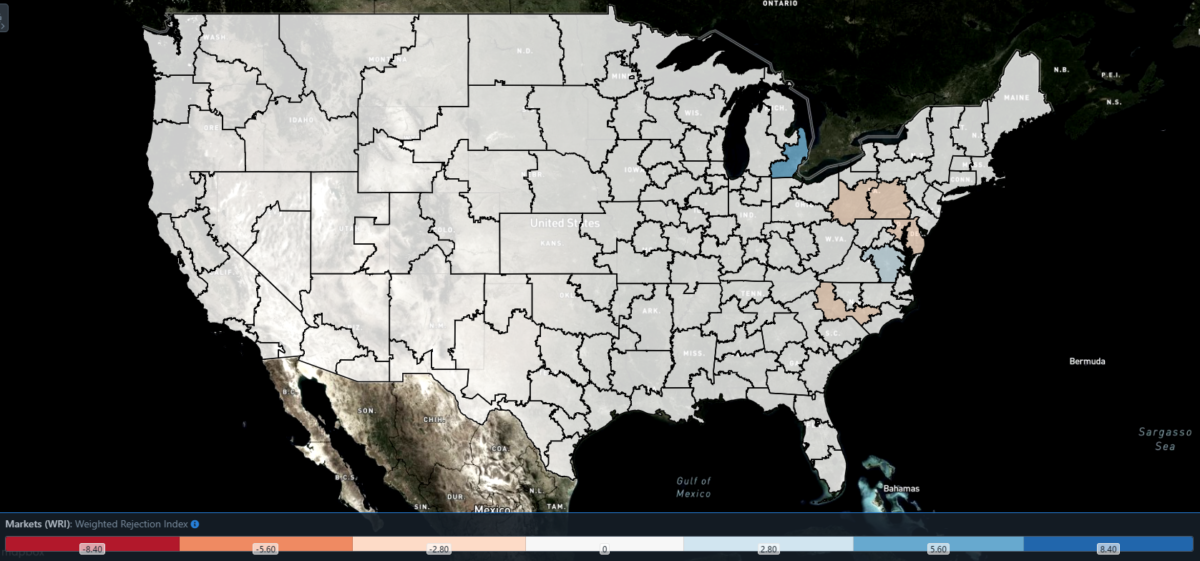
SONAR: WRI (color)
To learn more about FreightWaves SONAR, click here.
The map above shows the Weighted Rejection Index (WRI), the product of the Outbound Tender Reject Index — Weekly Change and Outbound Tender Market Share, as a way to prioritize rejection rate changes. As capacity is generally finding freight, this week only two regions posted blue markets, which are usually the ones on which to focus.
Of the 135 markets, 43 reported higher rejection rates over the past week, though 30 of those reported increases of only 100 or fewer bps.
In terms of rejection rates, Detroit has been the market to watch in the year so far. Its OTRI holiday bump was the most dramatic of any region, rising like a phoenix from sub-1% levels in mid-December to nearly 15.5% at the close of the year. After it saw an expected dip late last week, it then surprised yours truly with another plateau near 12%. Unfortunately, that little mesa looks like it was Detroit’s last hurrah, as its local OTRI is declining once again. Nevertheless, it is still up 269 bps w/w against that dip, sitting at 8.96%.
To learn more about FreightWaves SONAR, click here.
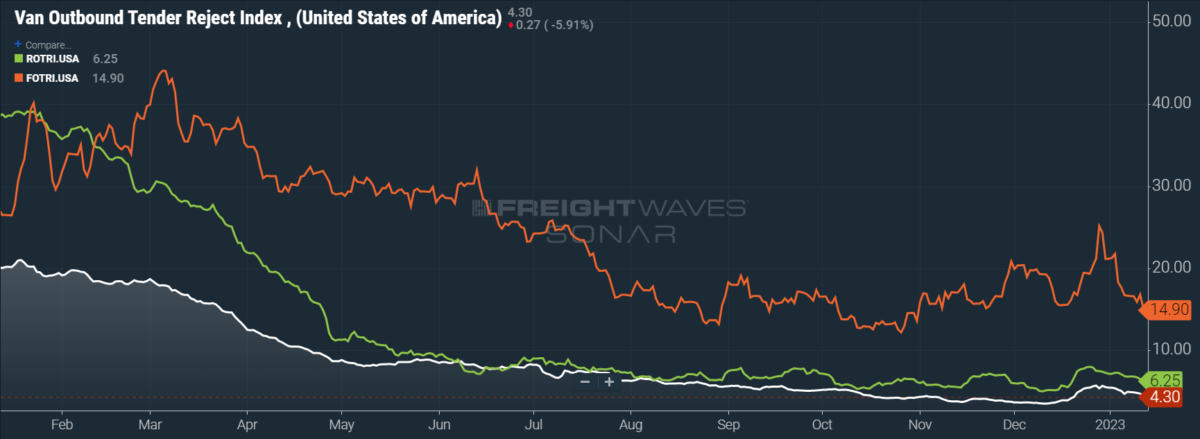
By mode: Flatbed rejection rates compounded last week’s loss of 761 bps w/w, as the Flatbed Outbound Tender Reject Index (FOTRI) is now down an additional 184 bps w/w at 14.9%. In my home state of Illinois, it was often said jokingly that there were exactly two seasons: winter and construction. Unfortunately for flatbed carriers, we are still firmly stuck in winter, with few sources of upward pressure on FOTRI nearby.
Van rejections fell similarly with the overall OTRI, with the Van Outbound Tender Reject Index (VOTRI) down 42 bps w/w. Despite making a weak recovery in volume, reefers are the mode most reluctant to give up their seasonal gains: While the Reefer Outbound Tender Reject Index (ROTRI) is down 63 bps w/w at 6.25%, ROTRI has been on a stepwise decline since Christmas. At each step, it threatens to level out.
Spot rates fall back to earth
In last week’s column, I discussed the temporary spike in diesel prices, which was caused by a severe cold snap that damaged U.S. refinery capacity. I also mentioned that January was forecast to have comparatively mild weather, which would not only allow for quick repairs to be made at refineries but also reduce overall demand for diesel fuel, which is used as a source of heating during the winter. I also noted how the spike in diesel prices had not yet been a factor in the National Truckload Index’s (NTI) weekly gains, which had been made purely through linehaul rate increases.
This week, I am happy to relate that the largest U.S. refinery is online once again after repairs, as are other refineries that saw similarly needed repairs. The bad news is that, in the interim when capacity was offline, stockpiles of diesel and other distillates fell 14% below the five-year average. This large draw will create ambient upward pressure on prices until those inventories are rebuilt.
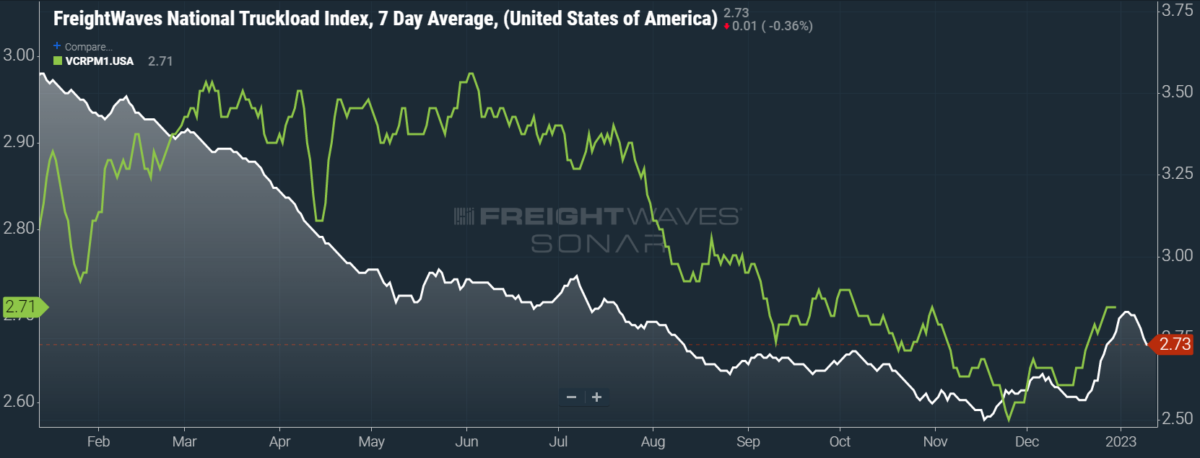
SONAR: National Truckload Index, 7-day average (white; right axis) and dry van contract rate (green; left axis).
To learn more about FreightWaves SONAR, click here.
This week, the NTI, which includes fuel surcharges and other accessorials, fell 9 cents per mile w/w to $2.73. As was the case last week, the fluctuation of diesel prices was not a factor on the NTI’s movement. The linehaul variant of the NTI (NTIL) — which excludes fuel surcharges and other accessorials — likewise fell 9 cents per mile w/w to $2.00.
It is during the early weeks of January when our contract rate data becomes the least actionable, since contract rates are reported on a two-week delay. At the time of writing, the most recent contract rate data reflects the run-up to New Year’s Eve, when prices are naturally elevated as capacity is more elusive. I stated in last week’s column that my readers and I would have to wait until early February to see whether my prediction that contract rates would drop substantially in Q1 2023 turns out to be true or false. Unfortunately, that timeline has not budged, and so we must content ourselves with only the holiday movements of contract rates.
Fortunately, we can draw comparisons to previous years, as the holiday bump is a seasonal phenomenon that occurs from mid-December to the end of the year. In 2022, contract rates rose 3.4% over this period — above 2021’s holiday rise of 2.2% but comfortably below 2020’s and 2019’s gains of 5.2% and 8%, respectively. We can also see in the above chart that the current movement of contract rates mirrors that of the NTI, which quickly began to lose momentum in 2023.
As of right now, however, contract rates — which exclude fuel surcharges and other accessorials like the NTIL — rose 2 cents per mile w/w to $2.71.
To learn more about FreightWaves SONAR, click here.
The chart above shows the spread between the NTIL and dry van contract rates, revealing the index has continued to fall to all-time lows in the data set, which dates to early 2019. Throughout that year, contract rates exceeded spot rates, leading to a record number of bankruptcies in the space. Once COVID-19 spread, spot rates reacted quickly, rising to record highs on a seemingly weekly basis, while contract rates slowly crept higher throughout 2021.
As linehaul spot rates remain 67 cents below contract rates, there is still runway for the latter to decline throughout the next six months.
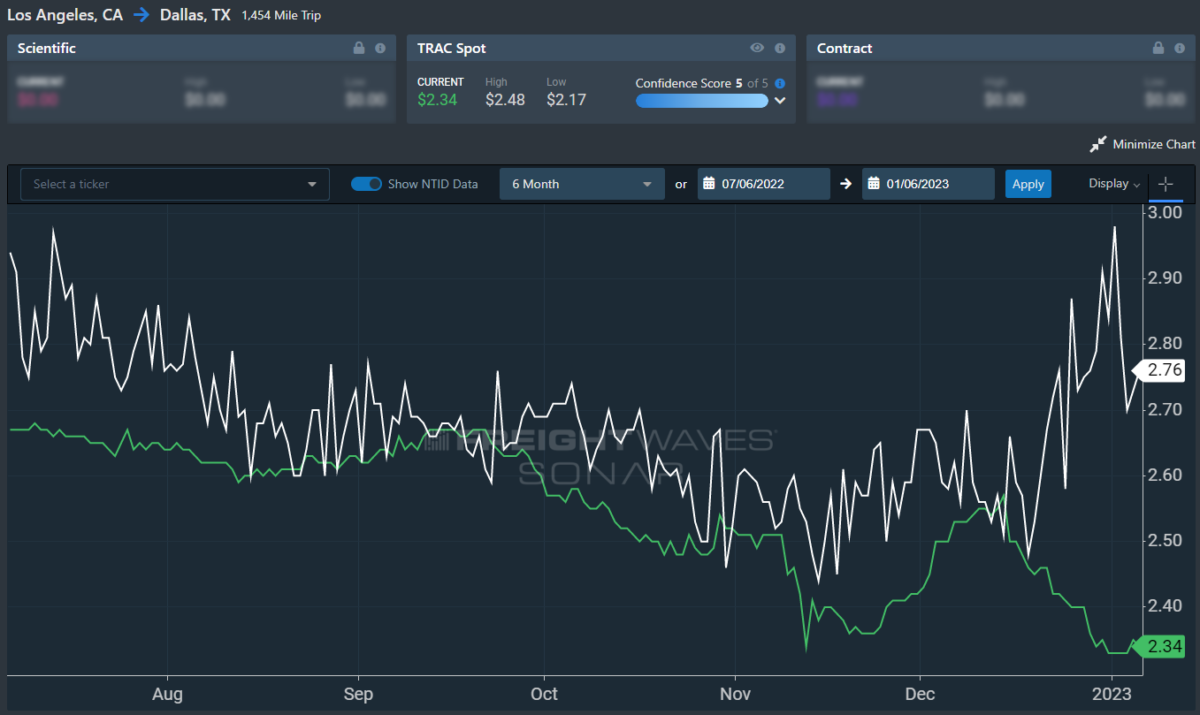
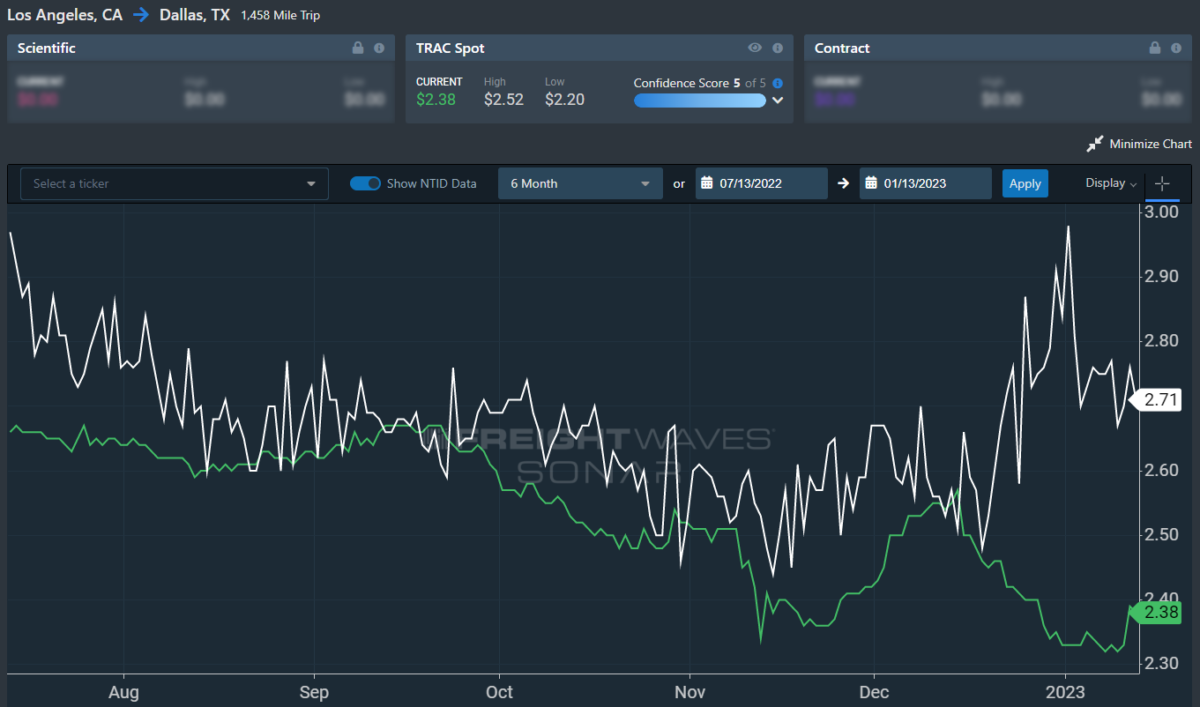
To learn more about FreightWaves TRAC, click here.
The FreightWaves TRAC spot rate from Los Angeles to Dallas, arguably one of the densest freight lanes in the country, saw a reprieve from its yearly lows. Over the past week, the TRAC rate rose 4 cents per mile w/w to $2.34. The daily NTI (NTID), which is elevated at $2.71, continues to outpace rates from Los Angeles to Dallas.
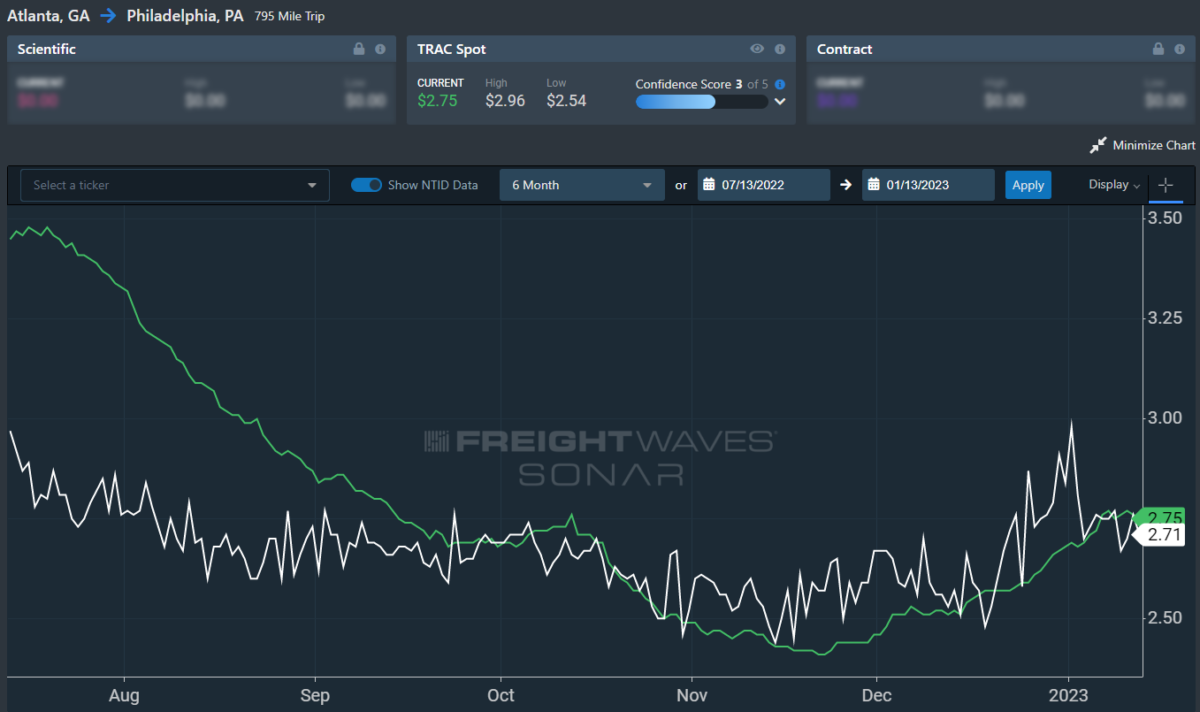
To learn more about FreightWaves TRAC, click here.
On the East Coast, especially out of Atlanta, rates also increased and are outpacing the NTID. The FreightWaves TRAC rate from Atlanta to Philadelphia rose 3 cents per mile this week to reach $2.75. Outside of the current holiday run, rates along this lane have been dropping steadily since mid-July, when the TRAC rate was $3.48 per mile.
For more information on the FreightWaves Passport, please contact Michael Rudolph at mrudolph@freightwaves.com or Tony Mulvey at tmulvey@freightwaves.com.
The post Freight outlook for January is grim but seasonal appeared first on FreightWaves.
Source: freightwaves - Freight outlook for January is grim but seasonal
Editor: Michael Rudolph