Freight News:
Freight market needs lithium during rapid swing toward bipolar low

Inconsistency is the only consistency in transportation over the past 4 years

Chart of the Week: Van Contract Initial Report, Van Outbound Tender Reject Index, Truckstop.com Average Van Spot Rate – USA SONAR: VCRPM1.USA, VOTRI.USA, TSTOPVRPM.USA
Trucking contract rates were still inflating as of early March, according to FreightWaves’ Van Contract Rate Index (VCRPM1), but spot and tender rejection rates are now in a free fall. The national average spot rate according to Truckstop.com has dropped 11.6%, or 44 cents per mile, over the past seven weeks, with the national average dry van tender rejection rate falling over 6 percentage points to its lowest value since June of 2020. Is this just another link in the self-perpetuating cycle of highs and lows for transportation?
There is no doubt the freight market is cooling off after an unprecedented period of elevated activity with spot rates falling and carrier compliance increasing at a record pace.
The fall was inevitable, while the timing was impossible to predict with precision. Even though many people knew this was coming, there will be those who are completely unprepared and suffer the greatest consequences.
Currently, consumer demand is finally eroding thanks in large part to inflation and a 180-degree turn in fiscal policy. The conflict in Ukraine appears to have been the proverbial straw that broke the market’s back by compounding inflationary pressures on multiple commodities, especially oil.
COVID-19 and the war in Ukraine were not predictable events, yet they are responsible for shaping the economy and disrupting supply chains over the past two years.
The consequence of free markets is volatility. While they may always try to move toward equilibrium, overcorrection is almost inevitable. This means many shippers may try to aggressively push rates back down on the contracted end. What they may not realize is that it was also the shippers that pushed the rates to where they are today, not the carriers.
Carriers set the price on the low end after they calculate their costs. Shippers set the upper end by bidding against each other for capacity. Carriers have been historically happy to attain around a 3-5% operating margin, which is almost a nonprofit organization in relation to many industry targets.
This low end expectation has kept the space in the dark ages in terms of technology and innovation as there is no money left over for investment. It is also a pretty strong barrier to entry for anyone with an entrepreneurial spirit.
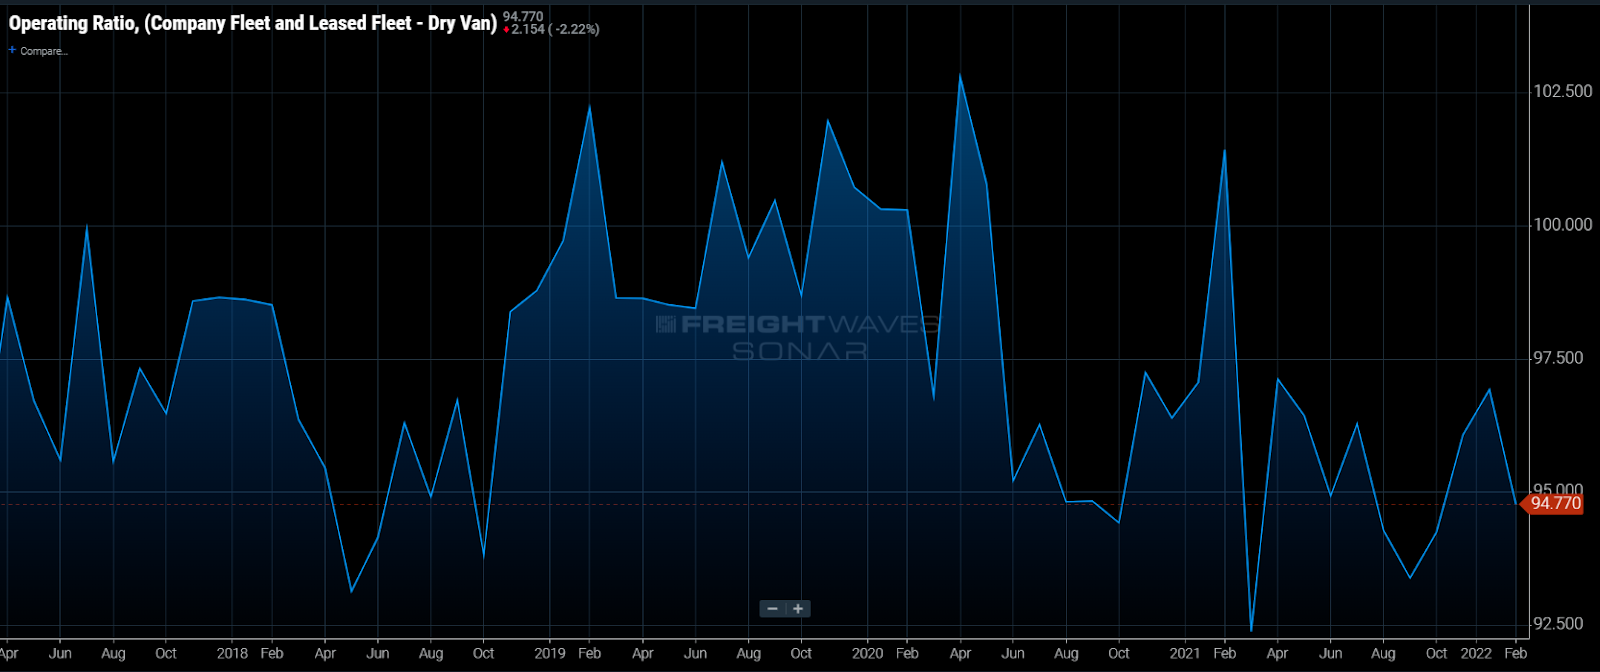
Looking at the Truckload Carriers Association data, which biases toward midsized to small carriers, they are still averaging operating ratios (OR) in the mid 90s as of February. Larger fleets such as Knight-Swift (NYSE: KNX) reported a 78.5% OR in the fourth quarter of 2021. This suggests the recent freight market boom has benefited larger carriers much more than the smaller fleets.
The reasons for this are worthy of another article, but the point of this comparison is to explain what a downturn in the market will actually do to the carrier landscape as it sets up another pendulum swing.
A downturn in rates will hurt the smaller fleets more, reducing the competition and setting up another spike in rates when things tighten. Less competitive units lead to higher prices.
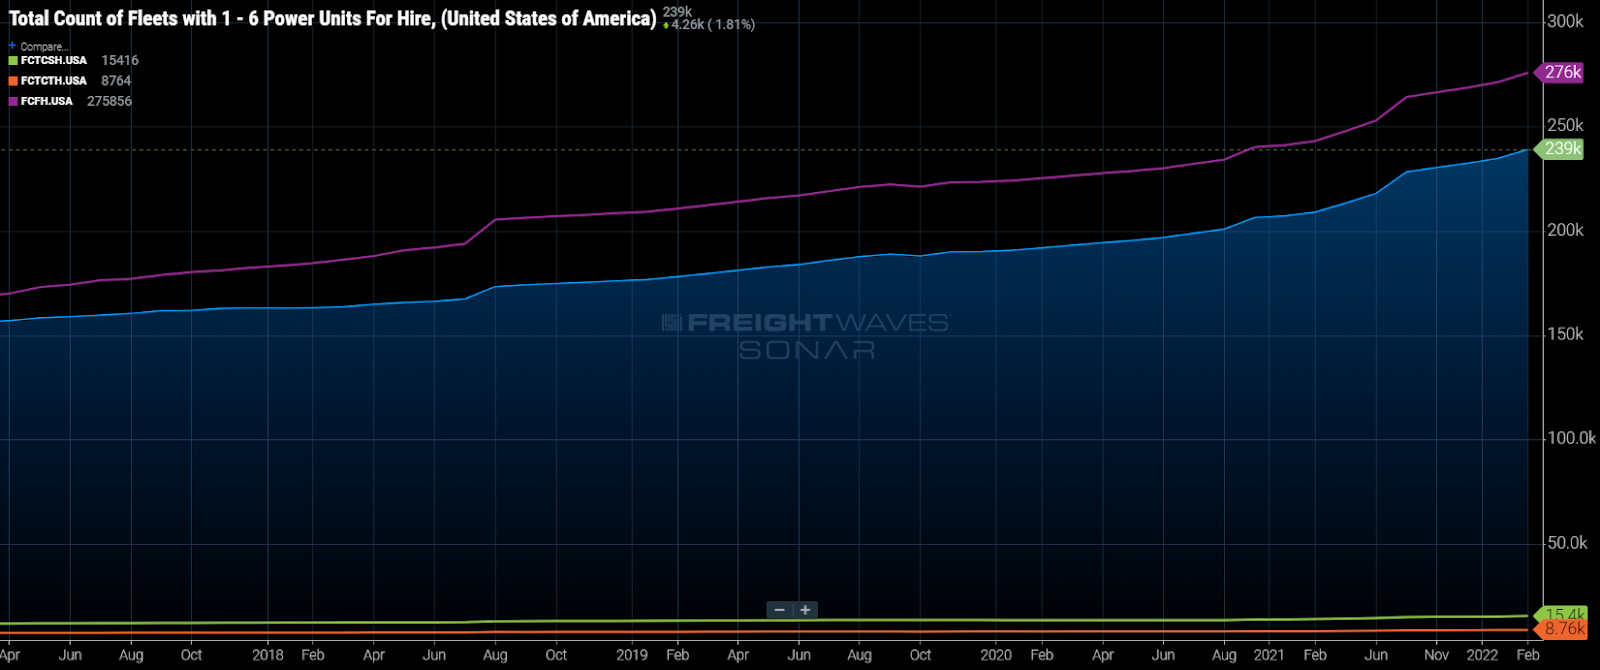
Ninety-five percent of the fleets in operation in the U.S. have fewer than 21 trucks, according to the FMCSA. Larger fleets sold off a lot of their older equipment last year while the price of used trucks spiked.
Most of the used truck market is made up of smaller fleets and owner-operators, who now have the burden of having to carry the full cost of an asset that will lose value at an accelerated pace during a market slowdown.
FreightWaves CEO Craig Fuller’s article was spot-on about the “blood bath” that is expected to occur. But the larger fleets will get more of a scrape as they have stockpiled cash and limited their fleet expansion efforts in large. This is not to vilify the larger fleets, but to explain that what they have done is simply smart business in a highly competitive environment.
Shippers would be wise to understand what they are dealing with in terms of what generates these wild swings as they are also participating in perpetuating it.
Fluid pricing models have grown in usage over the past 18 months. These may make capacity easier to attain on the upswing, but may actually accelerate the push toward an undersupplied market as margins erode faster. Each of the previous two freight market expansions was preceded by freight recessions (2016-17, 2019-20).
A more diversified approach to sourcing along with a dynamic pricing model with boundaries/triggers in place makes the most sense. To execute on this, you need objective and reliable information. The carrier/shipper relationship will never be one of complete trust, but it can be managed to be one with less volatility.
About the Chart of the Week
The FreightWaves Chart of the Week is a chart selection from SONAR that provides an interesting data point to describe the state of the freight markets. A chart is chosen from thousands of potential charts on SONAR to help participants visualize the freight market in real time. Each week a Market Expert will post a chart, along with commentary, live on the front page. After that, the Chart of the Week will be archived on FreightWaves.com for future reference.
SONAR aggregates data from hundreds of sources, presenting the data in charts and maps and providing commentary on what freight market experts want to know about the industry in real time.
The FreightWaves data science and product teams are releasing new datasets each week and enhancing the client experience.
To request a SONAR demo, click here.
Source: freightwaves - Freight market needs lithium during rapid swing toward bipolar low
Editor: Zach Strickland, FW Market Expert & Market Analyst