Freight News:
Freight demand has not found the floor
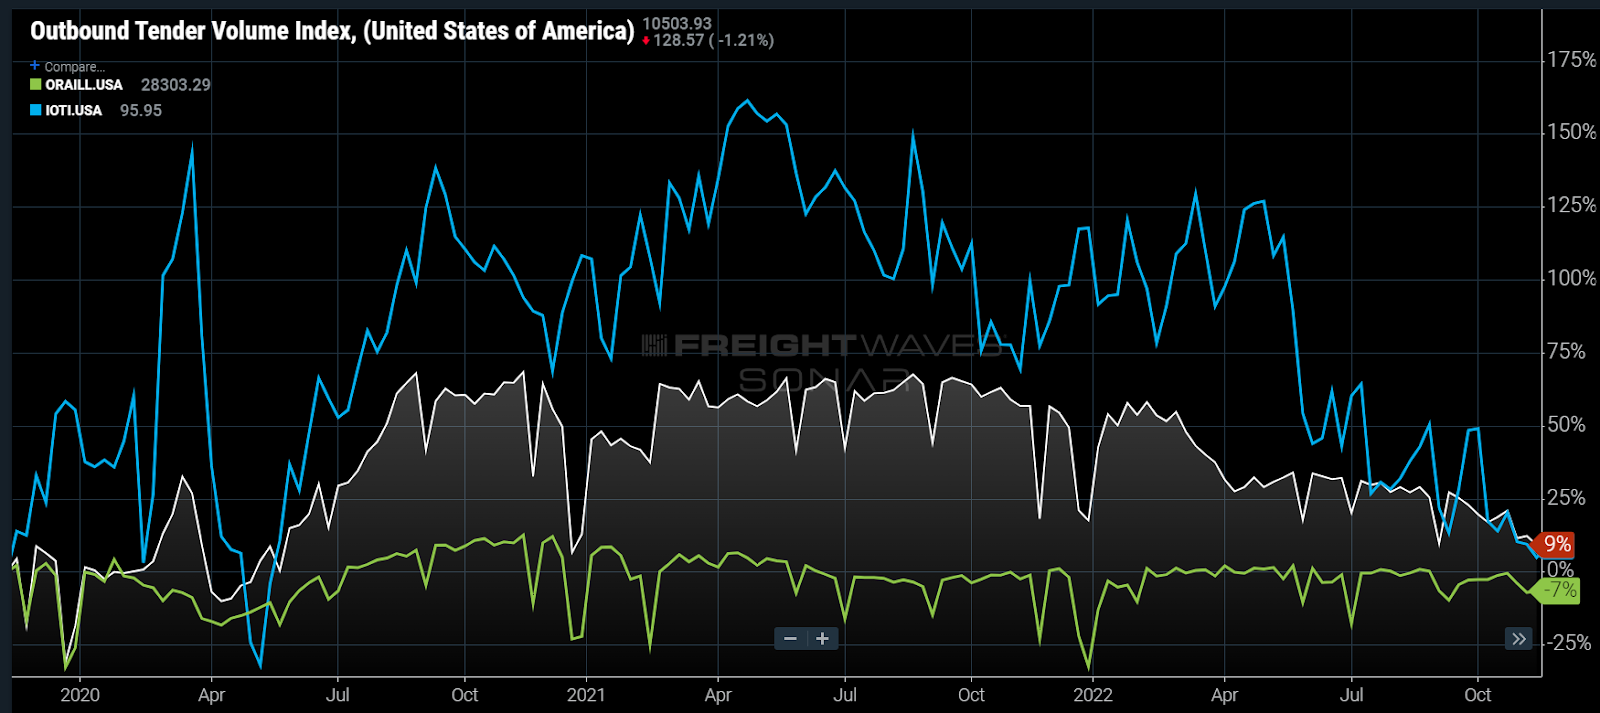
Chart of the Week: Outbound Tender Volume Index, Outbound Loaded Rail Containers, Inbound Ocean TEUs Index – USA SONAR: OTVI.USA, ORAILL.USA, IOTI.USA
Container imports, rail intermodal shipments and truckload demand have fallen from their lofty peaks during the pandemic era and may be a better indicator of how inflation will be tamed in the coming months than the Consumer Price Index (CPI) itself.
Container import bookings measured by FreightWaves’ Inbound Ocean TEUs Index (IOTI) are now only roughly 6% higher than they were in November 2019 after averaging 80% above pre-pandemic levels through most of 2021.
Loaded intermodal container volumes on the rails (ORAILL) are down 7% versus mid-November 2019 levels.
The Outbound Tender Volume Index (OTVI), a measure of shipper requests for truckload capacity, is now only 9% higher than it was the week before Thanksgiving in 2019 after averaging nearly 50% above pre-pandemic norms from July 2020 to March 2022.
Demand destruction has occurred at a much more significant level than suggested by the dollar figures that drive a lot of the macroeconomic data. Dollar values are noisy and measure emotion as well as supply and demand imbalances. The scarcity effect is a prime example of this and has been one of the main drivers of inflation over the past two years.
The CPI that is representative of inflation, the Fed’s No. 1 enemy, is still moving higher from an annual basis thanks to rising supply costs and companies still passing along upstream cost increases that occurred over the past two years.
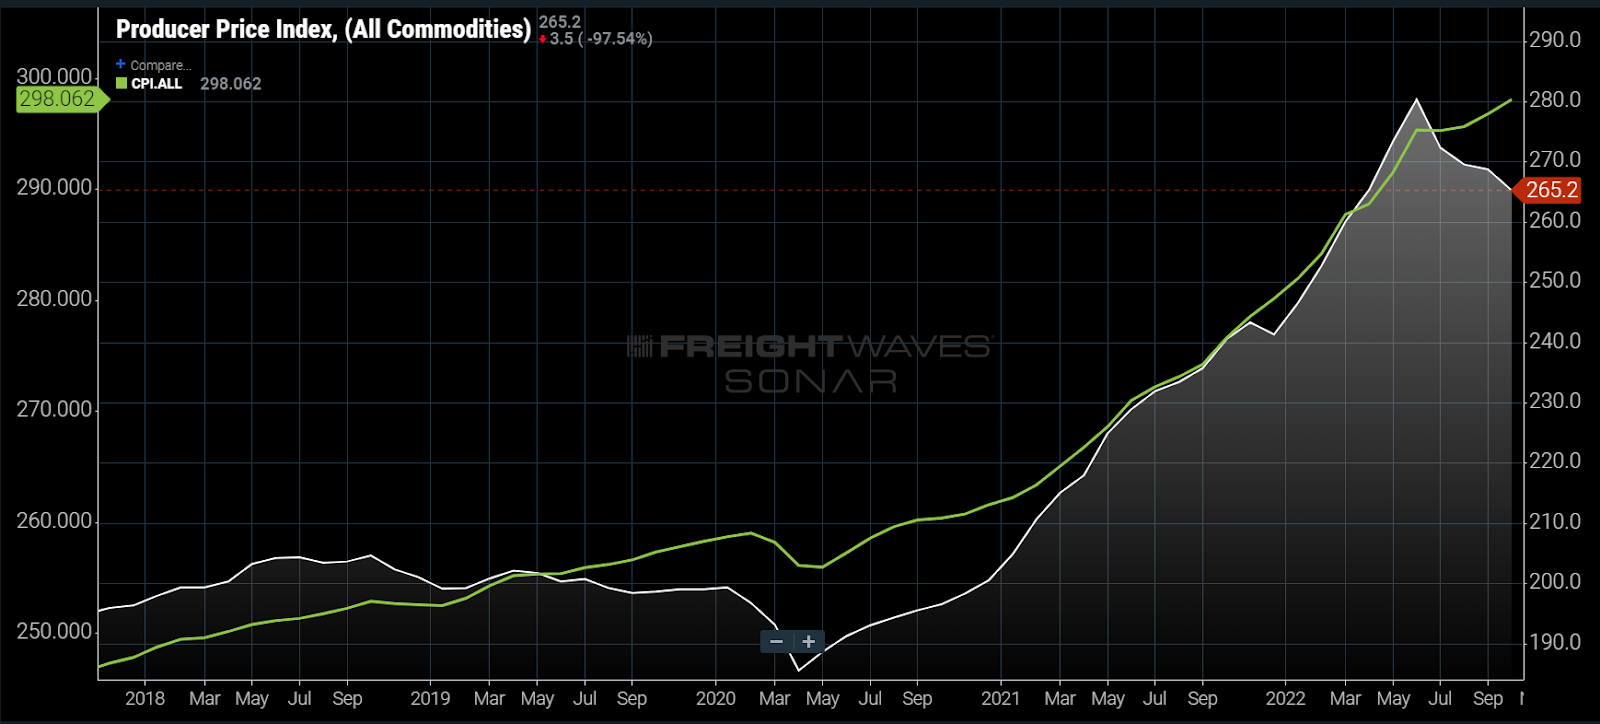
Looking at the Producer Price Index (PPI), which is focused more on upstream production costs, that direction has already changed and has been slowing since June. Transportation costs are a portion of this figure.
The point is that scarcity is diminishing. Supply chain congestion is easing. Consumer conditions have diminished from a purchasing power perspective. It takes time for this all to fully work its way into macroeconomic figures and behavior to change fully.
The transportation sector has been on the front end of both the economic boom and its recent decline. The reason for this is that transportation is the backbone of the goods economy. All goods, unfinished and finished, need to be moved at some point.
Raw materials move ahead of production and represent the furthest upstream view of aggregate demand. Finished goods moving to brick-and-mortar stores and fulfillment centers are also represented in transportation data.
While truckload and import demand may not have fully eroded back to pre-pandemic levels, the direction and time of the year suggest that it won’t be long until we are there. Seasonally speaking, retail volumes tend to spike just prior to and around the holidays, but there is little evidence of that at this point.
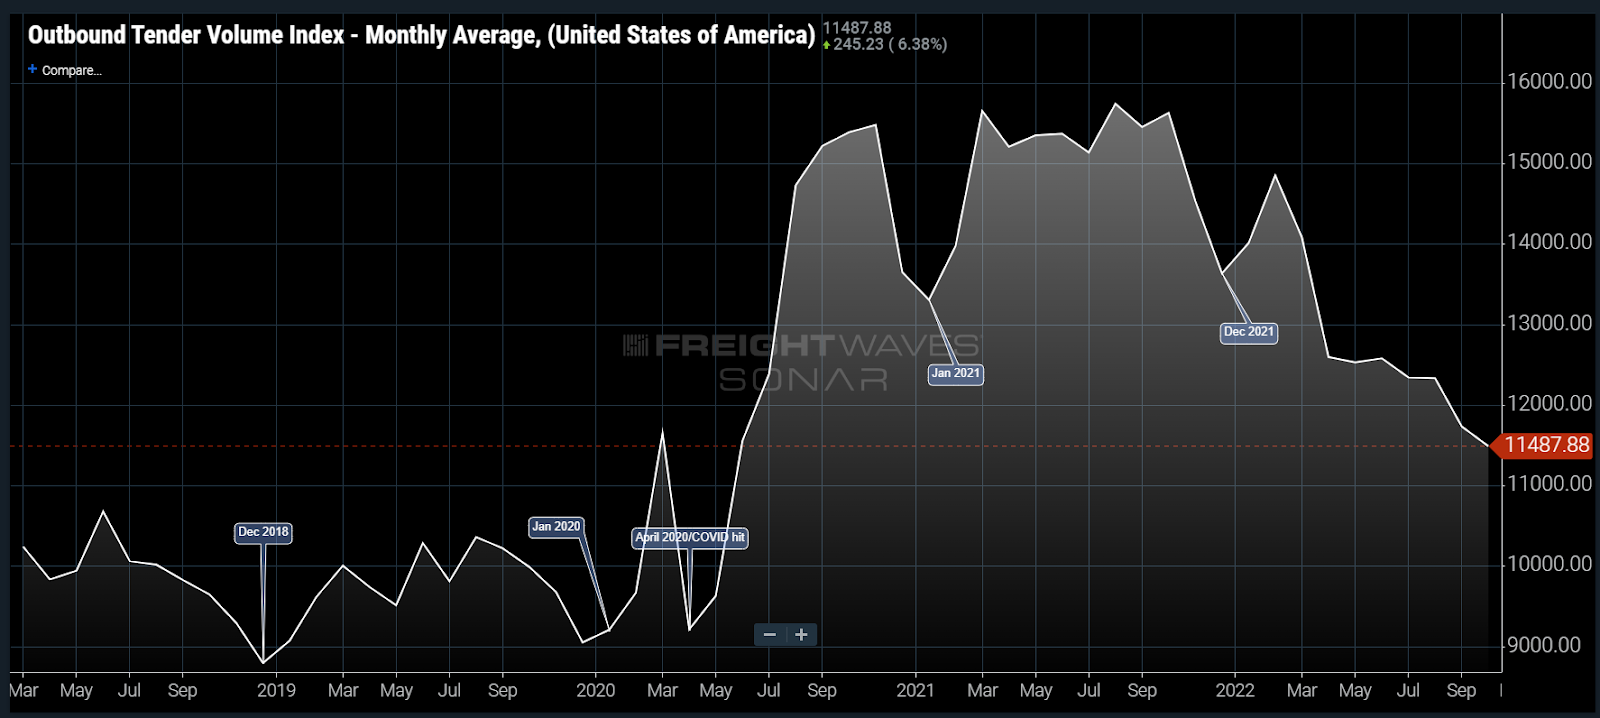
December and January are the slowest months of the year for domestic freight movements, meaning that it will probably get worse for transportation providers this winter without some sort of black swan event.
It is hard to tell how long this downward trend will last, as a lot of it will hinge on fiscal policy and investment sentiment. There is some surprising strength in labor numbers, which the Fed cites as a reason for continued rate increases, but this is a lagging figure that may still be reflecting past conditions.
About the Chart of the Week
The FreightWaves Chart of the Week is a chart selection from SONAR that provides an interesting data point to describe the state of the freight markets. A chart is chosen from thousands of potential charts on SONAR to help participants visualize the freight market in real time. Each week a Market Expert will post a chart, along with commentary, live on the front page. After that, the Chart of the Week will be archived on FreightWaves.com for future reference.
SONAR aggregates data from hundreds of sources, presenting the data in charts and maps and providing commentary on what freight market experts want to know about the industry in real time.
The FreightWaves data science and product teams are releasing new datasets each week and enhancing the client experience.
To request a SONAR demo, click here.
The post Freight demand has not found the floor appeared first on FreightWaves.
Source: freightwaves - Freight demand has not found the floor
Editor: Zach Strickland, FW Market Expert & Market Analyst