Freight News:
Flatbed capacity at its tightest due to surging oil prices, construction boom

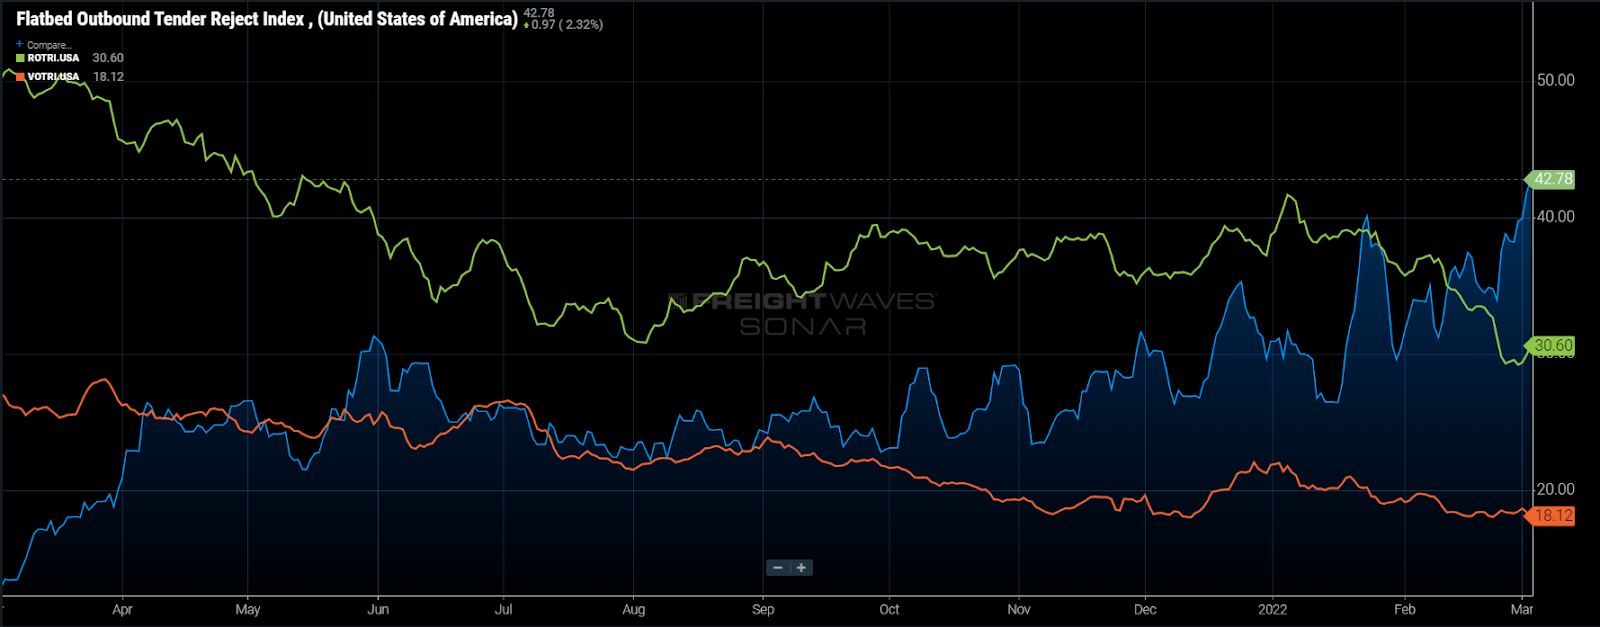
Chart of the Week: Flatbed Outbound Tender Rejection index, Van Outbound Tender Rejection index, Reefer Outbound Tender Rejection Index – USA SONAR: FOTRI.USA, VOTRI.USA, ROTRI.USA
The national Flatbed Outbound Tender Rejection Index (FOTRI) hit two all-time highs this week, while refrigerated and van rejection rates were down. Flatbed capacity had been gradually tightening over the past four months in a somewhat unseasonable pattern. This upward trend in the FOTRI has accelerated as spring approaches and much of the commodities that drive flatbed demand higher, like oil and building materials, are about to see breakout demand.
Flatbed trailers are the most flexible equipment type when it comes to the ability to haul goods. Their open decks allow for larger and oddly dimensioned items to be shipped without the constraints of a 53-foot trailer with an 8-by-13-foot opening for loading. Flatbed demand is heavily tied to domestic oil and energy, construction, and manufacturing activity because of this flexibility.
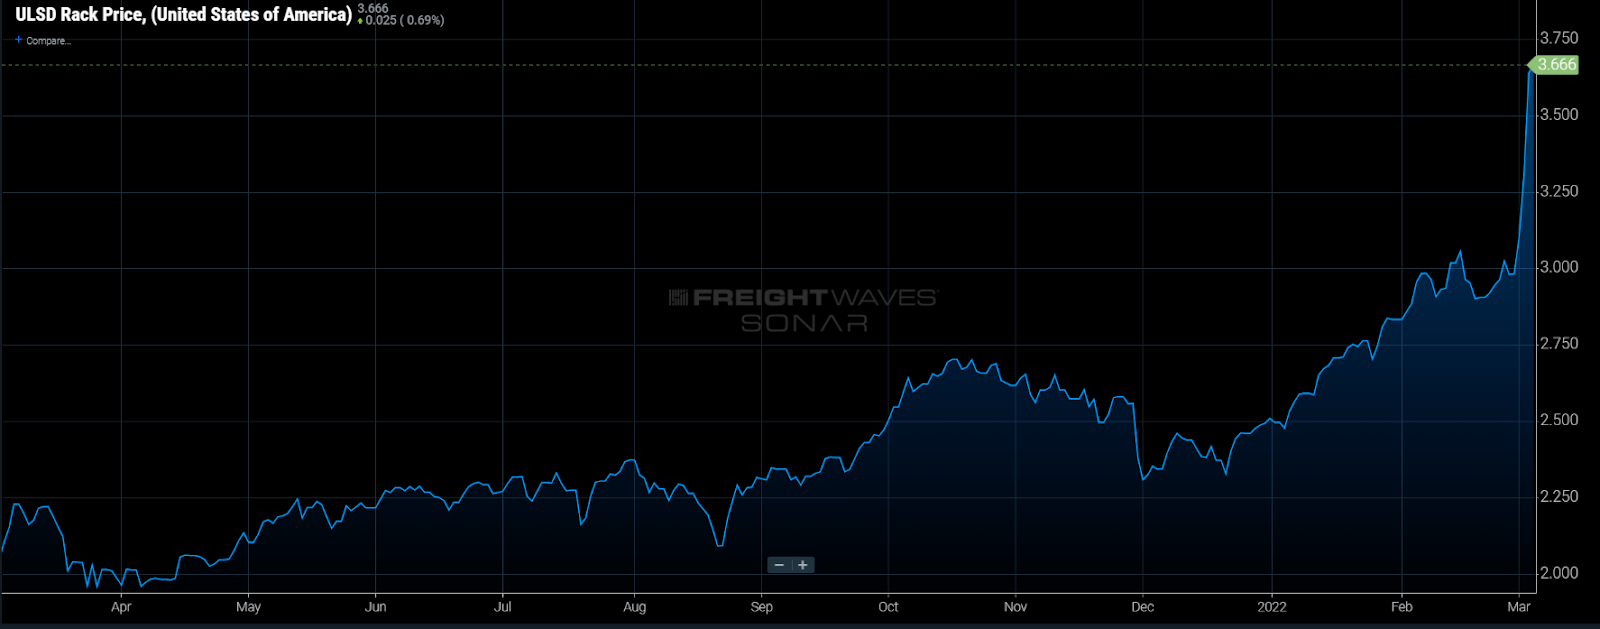
The flatbed sector is necessary for domestic oil and drilling operations as their trailer type is required not only for hauling the oversized equipment like pipes and casings, but also allows for loading and unloading of these items without a dock. When oil prices surge, this entices more companies to drill to capture the high rate of return. Russia’s invasion of Ukraine has pushed prices of West Texas crude over $100 a barrel, its highest point since 2011.
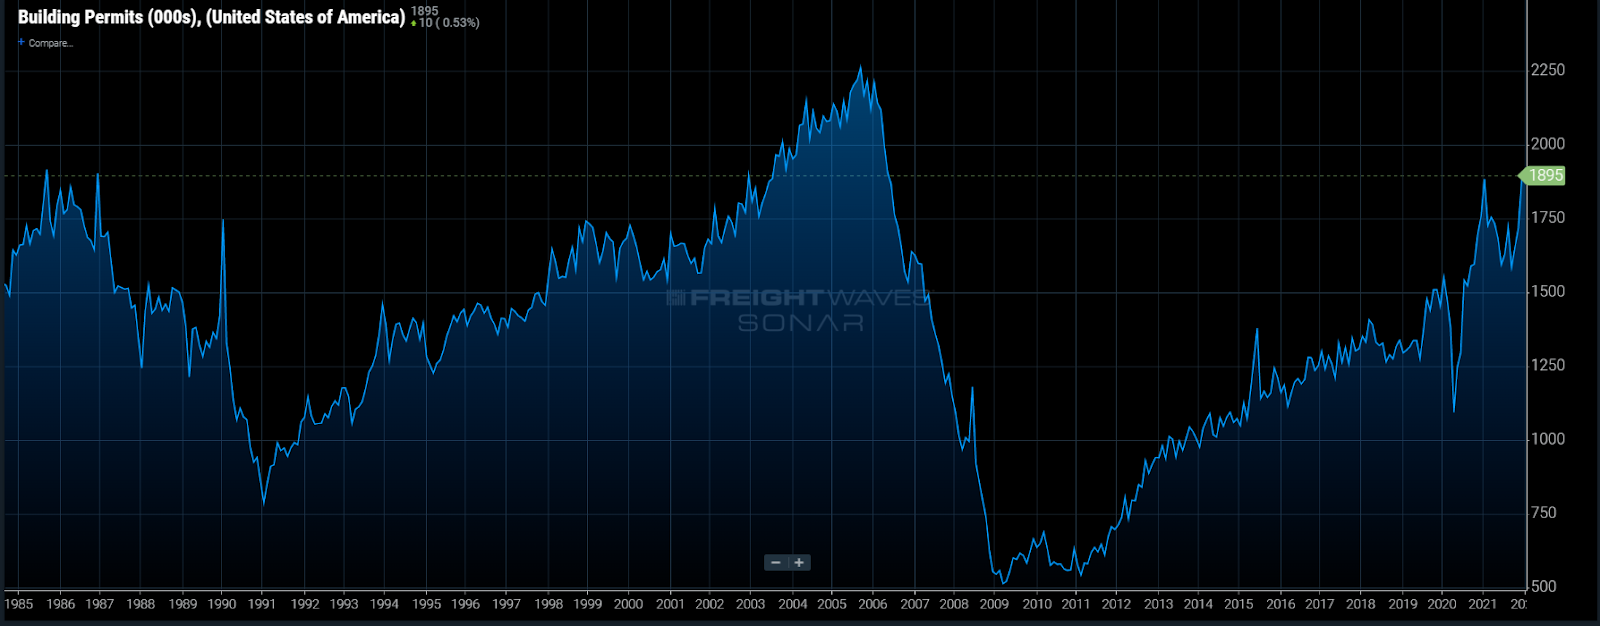
Low mortgage rates and the shift to working remotely led to a huge spike in construction of new home activity, and now the commercial side is finally catching up. Building permits are the highest they have been since May 2006, a leading indicator of construction activity.
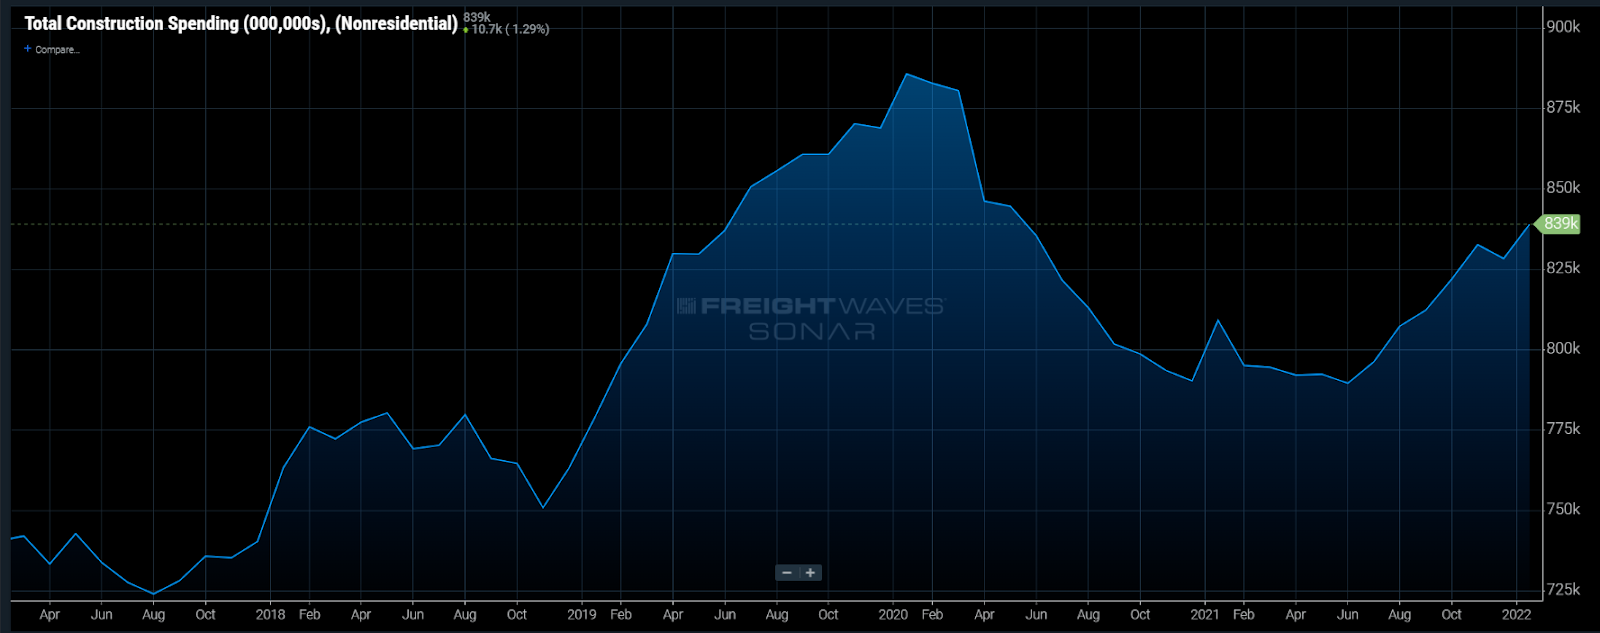
Most of the economic activity has been focused on consumer demand for goods. After 18 months of consumption, many companies are flush with cash and ready to invest. This is manifesting itself in the form of acquisitions and commercial investment in things such as warehouses and other supply chain infrastructure. After a slower year, construction spending on nonresidential buildings is trending higher.
In the early stages of the pandemic, the flatbed sector was the slowest to see a resurgence in activity. This led to many trading their trailers for the more profitable and more demanded van and reefer equipment types.
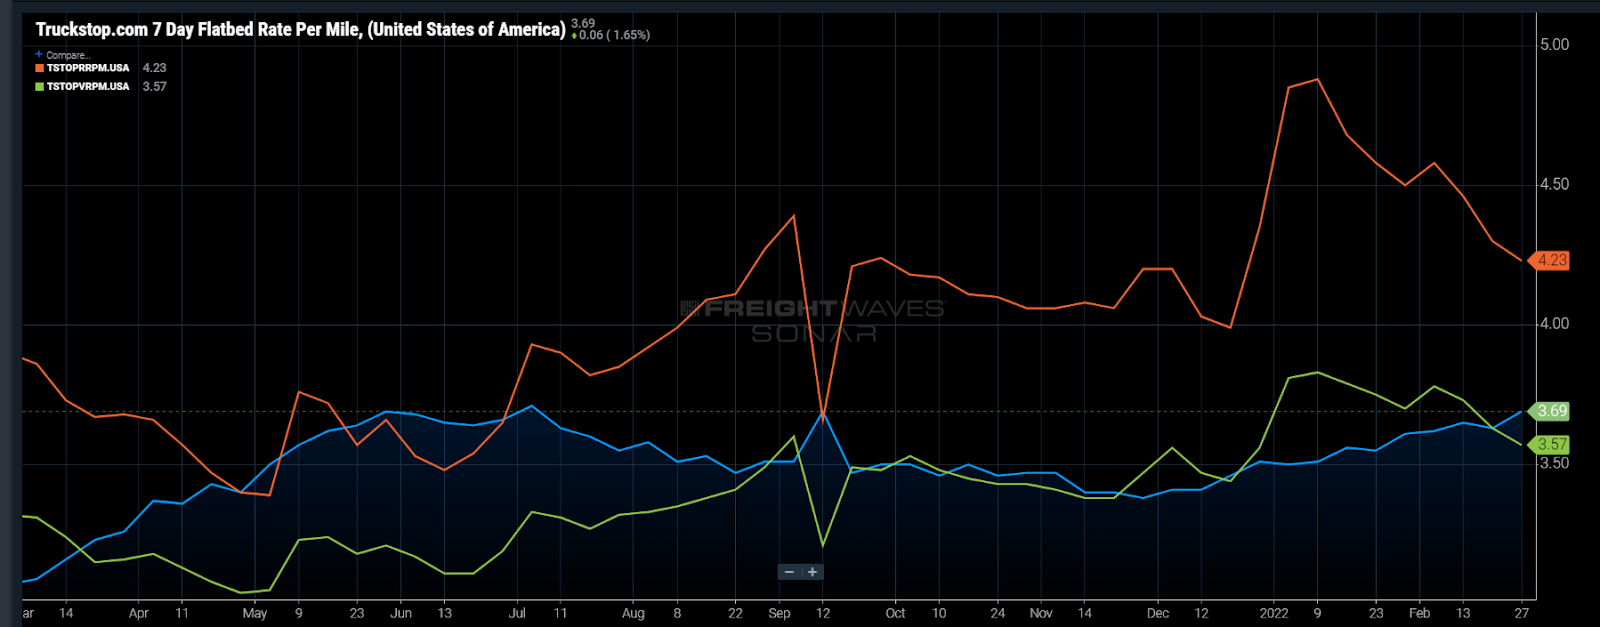
The average flatbed spot rate has increased 9% or roughly 31 cents per mile since the end of November, according to Truckstop.com’s top 100 lanes. By contrast, van is up 2.8% (8 cpm) and reefer is only up 0.7% (3 cpm). The more important takeaway is the direction of each mode’s rate. Flatbed is on a steady climb, whereas the other two are falling.
There is the potential for some of the investment activity to slow as the Fed prepares to increase interest rates later this month. Some of the construction-side action may be a bit of a pull forward as builders try to avoid sharp increases in the cost of funds. They are betting on the demand to remain in place over the next year, which appears to be likely at the moment with all the backlog in orders.
For the flatbedders, it appears this may be the year to stop hauling oversized pools and get back to moving the traditional wood and steel. This spring may be the perfect storm of economic and seasonal activity for a significant increase in flatbed prices.
About the Chart of the Week
The FreightWaves Chart of the Week is a chart selection from SONAR that provides an interesting data point to describe the state of the freight markets. A chart is chosen from thousands of potential charts on SONAR to help participants visualize the freight market in real time. Each week a Market Expert will post a chart, along with commentary, live on the front page. After that, the Chart of the Week will be archived on FreightWaves.com for future reference.
SONAR aggregates data from hundreds of sources, presenting the data in charts and maps and providing commentary on what freight market experts want to know about the industry in real time.
The FreightWaves data science and product teams are releasing new data sets each week and enhancing the client experience.
To request a SONAR demo, click here.
Source: https://www.freightwaves.com/news
Editor: Zach Strickland, FW Market Expert & Market Analyst