Freight News:
Empty wallets threaten seasonal growth
This week’s FreightWaves Supply Chain Pricing Power Index: 30 (Shippers)
Last week’s FreightWaves Supply Chain Pricing Power Index: 30 (Shippers)
Three-month FreightWaves Supply Chain Pricing Power Index Outlook: 35 (Shippers)
The FreightWaves Supply Chain Pricing Power Index uses the analytics and data in FreightWaves SONAR to analyze the market and estimate the negotiating power for rates between shippers and carriers.
This week’s Pricing Power Index is based on the following indicators:
Consumers tapping into a dry well
The gap between current levels of freight demand and those of 2019 is narrowing, casting doubt on the market’s ability to sustain seasonal growth. Given that the broader economy has been rocked by fears of another global financial crisis, this failure would be understandable. In fact, today’s market should be much weaker than it actually is: Not only does it suffer from 2019’s problem of persistent overcapacity, but the consumer has been battling extreme inflationary pressures for more than a year.

SONAR: OTVI.USA: 2023 (white), 2022 (blue) and 2021 (green)
To learn more about FreightWaves SONAR, click here.
This week, the Outbound Tender Volume Index (OTVI), which measures national freight demand by shippers’ requests for capacity, barely moved. OTVI rose 1.1% on a week-over-week (w/w) basis. On a year-over-year (y/y) basis, OTVI is down 23.7%, yet such y/y comparisons can be colored by significant shifts in tender rejections. OTVI, which includes both accepted and rejected tenders, can be artificially inflated by an uptick in the Outbound Tender Reject Index (OTRI).
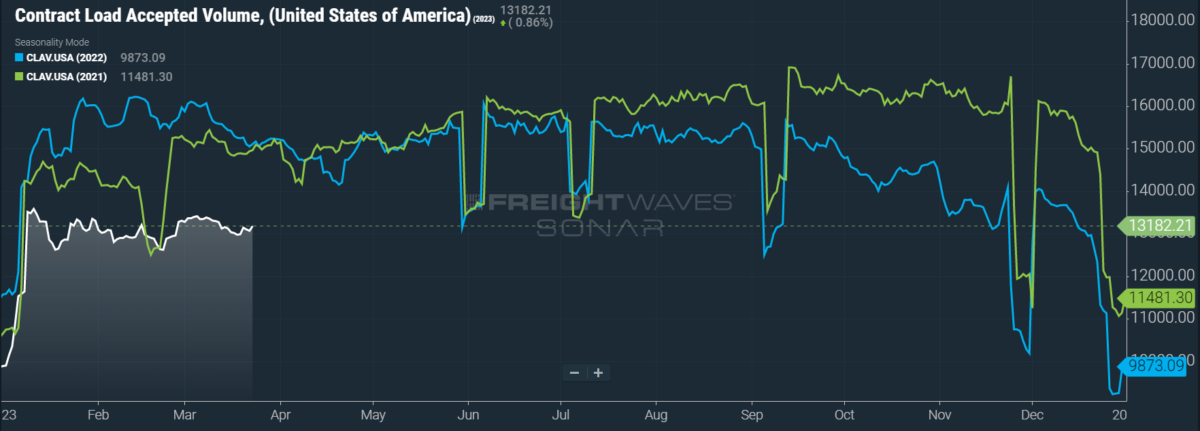
SONAR: CLAV.USA: 2023 (white), 2022 (blue) and 2021 (green)
To learn more about FreightWaves SONAR, click here.
Contract Load Accepted Volumes (CLAV) is an index that measures accepted load volumes moving under contracted agreements. In short, it is similar to OTVI but without the rejected tenders. Looking at accepted tender volumes, we see a slim rise of 1.1% w/w as well as a fall of 12.8% y/y. This y/y difference confirms that actual cracks in freight demand — and not merely OTRI’s y/y decline — are driving OTVI lower.
Banking panics aside, the economy has been sending confusing signals for several months now. By simple logic, the drastic rise of inflation should compel consumers to tighten their budgets and lessen their discretionary spending. But, instead of succumbing to these economic headwinds, consumers are largely opting to spend. Per data from Bank of America, discretionary spending across all income levels accounted for a greater share of total spending in February 2023 than it did in ’22.
On the other hand, consumers do in fact appear to be in a precarious position. In January, personal savings rates were at their lowest since September 2008, when the world was in the throes of the last global financial crisis. Consumers’ addiction to credit also continues to be a threat: In January, the total amount of revolving credit (which includes credit card debt) rose 11.1% y/y to $1.2 trillion, up from 6.9% y/y growth in December.
E-commerce giants are beginning to feel the flames at their backs, with weakness in domestic parcel volumes from the fourth quarter of 2022 persisting into Q1 2023. In January, FreightWaves’ Rachel Premack reported on the demand destruction for cardboard boxes in Q4. Of course, given the ubiquity of boxes found in all of retail, especially in e-commerce parcels, this decline is a leading indicator for consumers’ discretionary demand.

SONAR: Outbound Tender Volume Index – Weekly Change (OTVIW).
To learn more about FreightWaves SONAR, click here.
Of the 135 total markets, 70 reported weekly increases in tender volume, a showing of mixed results in heavyweight and middling markets alike.
The industrial markets of Michigan were arguably the winners of the week. Detroit saw freight demand rise 13.06% w/w — the largest such increase among major markets. The neighboring market of Grand Rapids, a robust yet smaller industrial region, saw decent 6.76% w/w growth in tender volumes. Harrisburg, Pennsylvania, a busy throughput market of imports and domestic shipments from New England, benefited from a 5.68% w/w rise in freight activity.
By mode: A major setback came for reefer volumes this week, when the Reefer Outbound Tender Volume Index (ROTVI) fell 4.82% w/w. California’s produce season is threatened by extreme flooding, leading to delayed harvests and weaker yields. Dry van activity, meanwhile, has slightly recovered from consecutive weeks of infirmity. The Van Outbound Tender Volume Index (VOTVI) was up 2% w/w, outpacing the overall OTVI for the first time since February.
Another one bites the dust
No major movement was seen in OTRI this week, with tender rejection rates still lingering near all-time lows. Yearly comparisons should become more favorable soon, since the first domino to fall late last March was OTRI’s steep decline.

SONAR: OTRI.USA: 2023 (white), 2022 (blue) and 2021 (green)
To learn more about FreightWaves SONAR, click here.
Over the past week, OTRI, which measures relative capacity in the market, fell to 3.57%, a change of 2 basis points (bps) from the week prior. OTRI is now 1,170 bps below year-ago levels.
Adding to the layoffs and bankruptcies seen earlier in the month was the closure of Flagship Transport, a Florida-based carrier with roughly 455 drivers in its employ. With 461 power units under its umbrella, Flagship’s fleet size places it among the largest carriers in an industry in which fewer than 3% of fleets operate with 20 or more power units. Unlike other layoffs and closures, however, Flagship has been radio silent with its employees since last week after its checks began bouncing over the past few weeks. The amount of back pay that Flagship owes to its drivers ranges from $5,000 to $20,000, possibly even more.

SONAR: WRI (color)
To learn more about FreightWaves SONAR, click here.
The map above shows the Weighted Rejection Index (WRI), the product of the Outbound Tender Reject Index — Weekly Change and Outbound Tender Market Share, as a way to prioritize rejection rate changes. As capacity is generally finding freight this week, a few markets posted blue markets, which are usually the ones to focus on.
Of the 135 markets, 62 reported higher rejection rates over the past week, though 37 of those saw increases of only 100 or fewer bps.

To learn more about FreightWaves SONAR, click here.
By mode: Despite a slight decline in the overall OTRI this week, most modes saw equally slim growth in tender rejections. Unsurprisingly, flatbeds proved to be the exception: The Flatbed Outbound Tender Reject Index (FOTRI) slid 81 bps w/w to 16.85%. High mortgage rates continue to dampen construction of single-family homes, despite a recent jump in February housing starts. The Van Outbound Tender Reject Index (VOTRI) rose 5 bps w/w to 3.44%, while the Reefer Outbound Tender Reject Index (ROTRI) gained 16 bps w/w to reach 3.97%.
Survey says: Transportation prices unsurprisingly weak
The February release of the Logistics Managers’ Index saw the headline index slide closer to contractionary territory. The primary driver of February’s loss was a steep decline in the Transportation Prices Index, which tumbled 5.9 points m/m to 36.1. (Similar to the PPI, a reading above 50 indicates expansion, while a reading below 50 indicates contraction.) This latest reading puts the component index at its fastest rate of contraction in the LMI’s history, which dates back to 2016.

SONAR: National Truckload Index, 7-day average (white; right axis) and dry van contract rate (green; left axis).
To learn more about FreightWaves SONAR, click here.
This week, the National Truckload Index (NTI) — which includes fuel surcharges and other accessorials — gained 1 cent per mile to reach $2.34. Declining diesel prices did not have much impact on this rise one way or the other, as the linehaul variant of the NTI (NTIL) — which excludes fuel surcharges and other accessorials — similarly rose 1 cent per mile w/w to $1.67.
Contract rates, which exclude fuel surcharges and other accessorials like the NTIL, gained 2 cents per mile w/w yet remain far more stable than spot rates, given the average length of shippers’ bid cycles. Contract rates, which are reported on a two-week delay, presently sit at a national average of $2.55 per mile. Despite this recent gain, contract rates should be expected to decline once again in Q2.

To learn more about FreightWaves SONAR, click here.
The chart above shows the spread between the NTIL and dry van contract rates, revealing the index has fallen to all-time lows in the data set, which dates to early 2019. Throughout that year, contract rates exceeded spot rates, leading to a record number of bankruptcies in the space. Once COVID-19 spread, spot rates reacted quickly, rising to record highs on a seemingly weekly basis, while contract rates slowly crept higher throughout 2021.
Despite this spread narrowing significantly over the first few weeks of the year, tightening by 20 cents per mile in January, it has continued to widen again. Since linehaul spot rates remain 86 cents below contract rates, there is still plenty of room for contract rates to decline over the coming months.

To learn more about FreightWaves TRAC, click here.
The FreightWaves TRAC spot rate from Los Angeles to Dallas, arguably one of the densest freight lanes in the country, was on an unstoppable decline since January but has finally leveled out. Over the past week, the TRAC rate rose 1 cent per mile to $2.01, still a far cry from its year-to-date high of $2.39. The daily NTI (NTID), which sits at $2.34, is greatly outpacing rates from Los Angeles to Dallas.

To learn more about FreightWaves TRAC, click here.
On the East Coast, especially out of Atlanta, rates similarly remained constant and are also outpaced by the NTID. The FreightWaves TRAC rate from Atlanta to Philadelphia did not budge the needle this week, staying at $2.31. Except for Q4’s holiday run, rates along this lane have been dropping stepwise since July 2022, when the TRAC rate was $3.48 per mile.
For more information on the FreightWaves Passport, please contact Michael Rudolph at mrudolph@freightwaves.com or Tony Mulvey at tmulvey@freightwaves.com.
The post Empty wallets threaten seasonal growth appeared first on FreightWaves.
Source: freightwaves - Empty wallets threaten seasonal growth
Editor: Michael Rudolph