Freight News:
CPGs grapple with uncertain consumer behavior

How well will consumer packaged goods (CPG) purchases ultimately hold up?
Not only is CPG demand forecasting arguably more difficult than ever, it is also more critical than normal since many CPGs have to decide whether to continue with high-cost contract manufacturing that served as a way to find capacity during the pandemic when demand for CPGs was generally elevated.
The latest consumer data paints a picture of a consumer who lacks confidence, has reassessed priorities and is cutting back in select areas while still trying to maintain the same standard of living, which is currently being supported by dipping into savings accumulated during the pandemic and by credit card spending. There hasn’t (yet?) been tremendous consumer retrenchment in terms of the absolute dollars being spent, but it remains to be seen how sustainable current spending levels are.
Here are a few recent data points and anecdotes that highlight the latest consumer trends:
- Discount retail is taking share from traditional grocers. Walmart is growing in grocery while higher food prices are leaving less money available for the rest of the store, where the retailer earns higher margins. The demographic looking to big-box discounters for savings on groceries is wide — three-quarters of Walmart’s market share gains in food came from consumers with annual household incomes of $100,000 or more.
- Inventory levels remain bloated. It’s been one quarter since Walmart and Target made it clear to investors that they had way too much inventory, and despite major initiatives to right-size inventory levels, that appears to be a process that will take a number of quarters, exacerbated by still-high import volumes and continued consumer caution. At the end of the second quarter, Walmart’s inventory was 26% higher y/y and down only 2% sequentially. Similarly, Target’s inventory levels were 36% higher y/y and 2% higher sequentially.
- Consumers are buying cheaper cuts of meat. Tyson reported a mix-shift toward chicken and away from beef and pork, which both experienced volume declines in the past quarter. That is notable because consumers had been accepting meat price increases of 20%-40% during the pandemic with little demand destruction.
- Private-label brands are taking share. According to private-label food manufacturer TreeHouse Foods, private-label brands posted volume growth of 2% in the second quarter, as compared with a 5% volume decline for the national brands. Tyson also cited a market share loss in meat to less costly private labels.
- Most publicly traded CPGs maintain that their elasticities remain below historic levels. However, even those bullish comments reflected a change in tone and wording from prior releases. Previously, the CPGs had discussed quarterly results while citing little to no demand degradation in response to rising prices.
- The recent decline in fuel prices has provided some relief. That appears to be showing up in the latest data on consumer spending, which increased 0.8% m/m in July.
- The personal savings rate hit a recent low. The personal savings rate in July was just 5.1%, which is well below the average of the past 10 years.
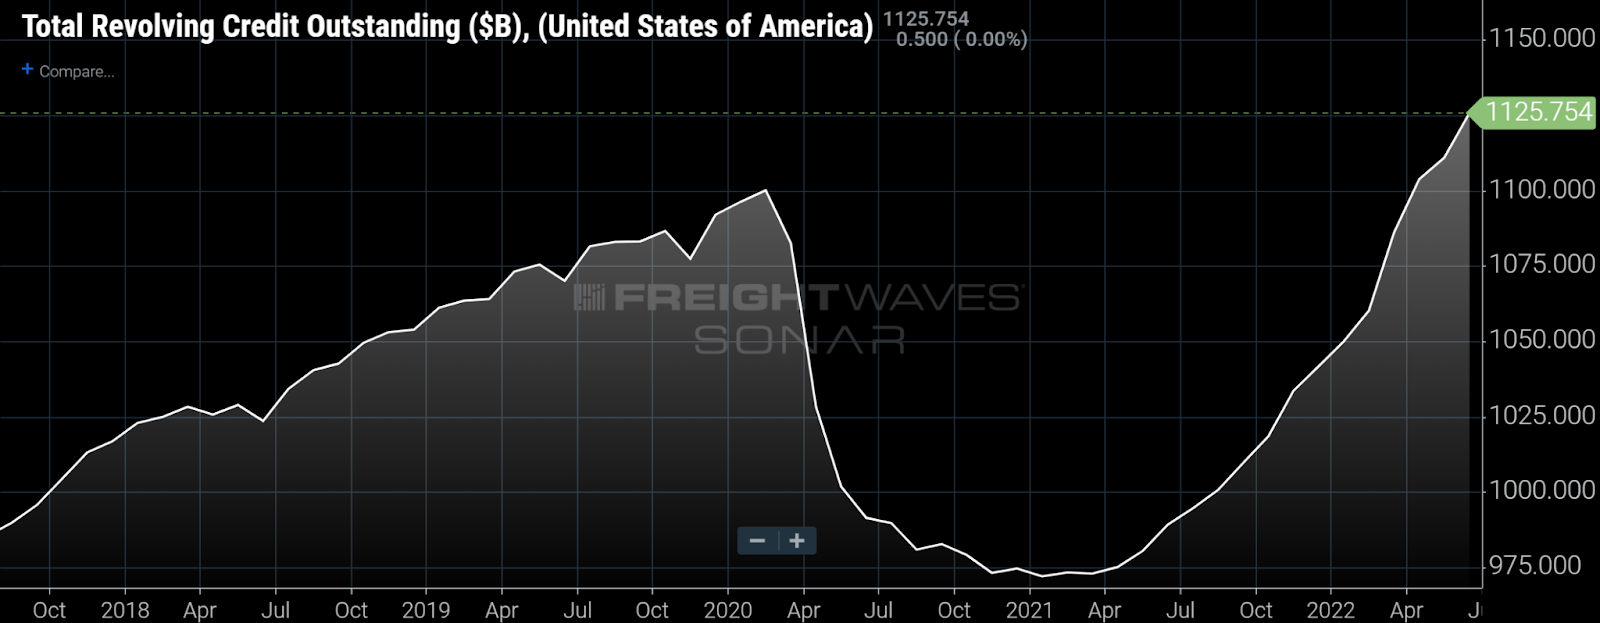
- Consumers are borrowing more. After accumulating savings during the early days of the pandemic, consumers have been making up for lost time and putting more on their credit cards, with balances now above pre-pandemic levels. That comes in addition to higher balances of nonrevolving credit associated with the recent housing boom (which now may be behind us) and record home prices.
Here are a three other SONAR charts that stand out:
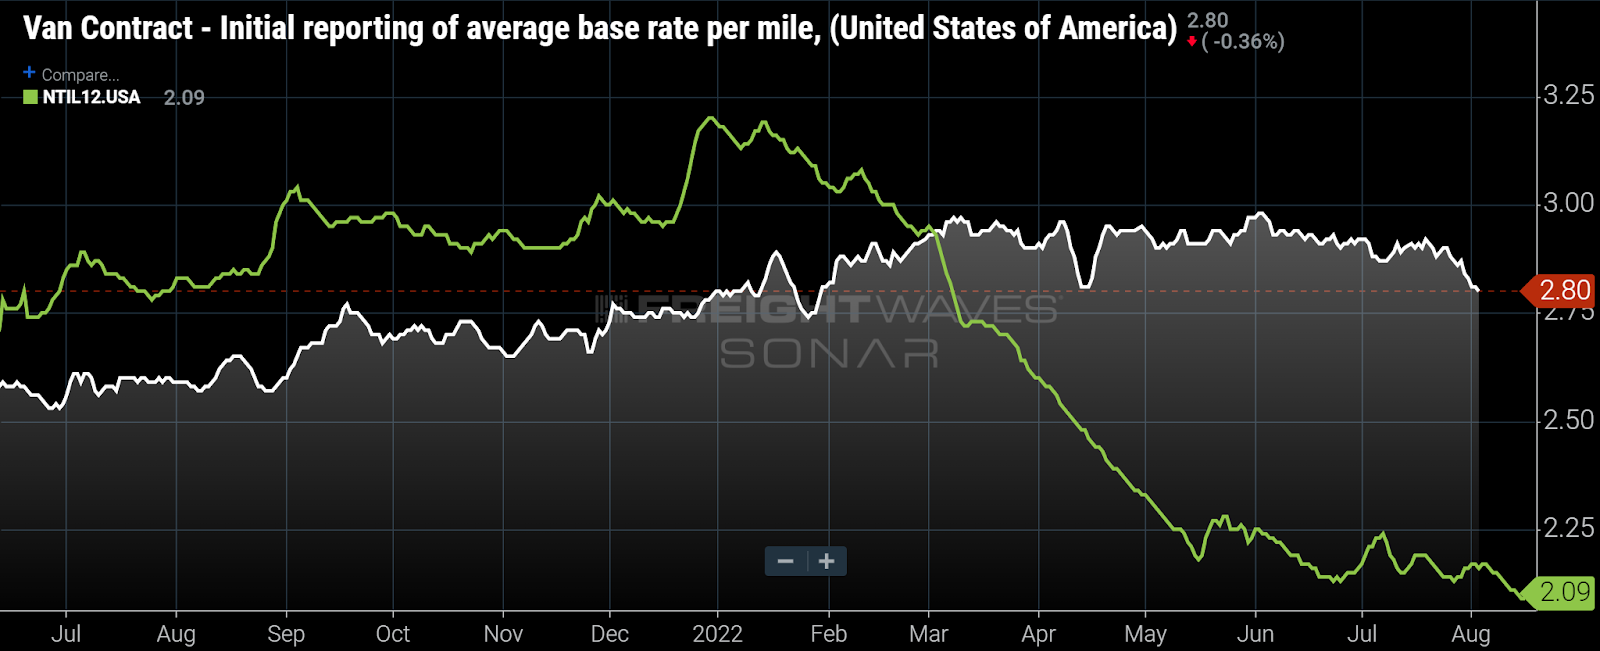
Van contract rates (national average — white line), which average $2.80 a mile, excluding fuel, are down from their high near $3 a mile. Spot rates (green line), which are adjusted to remove fuel, are 71 cents a mile lower at $2.09. That spread is unsustainable and suggests that contract rates have considerable room to fall.
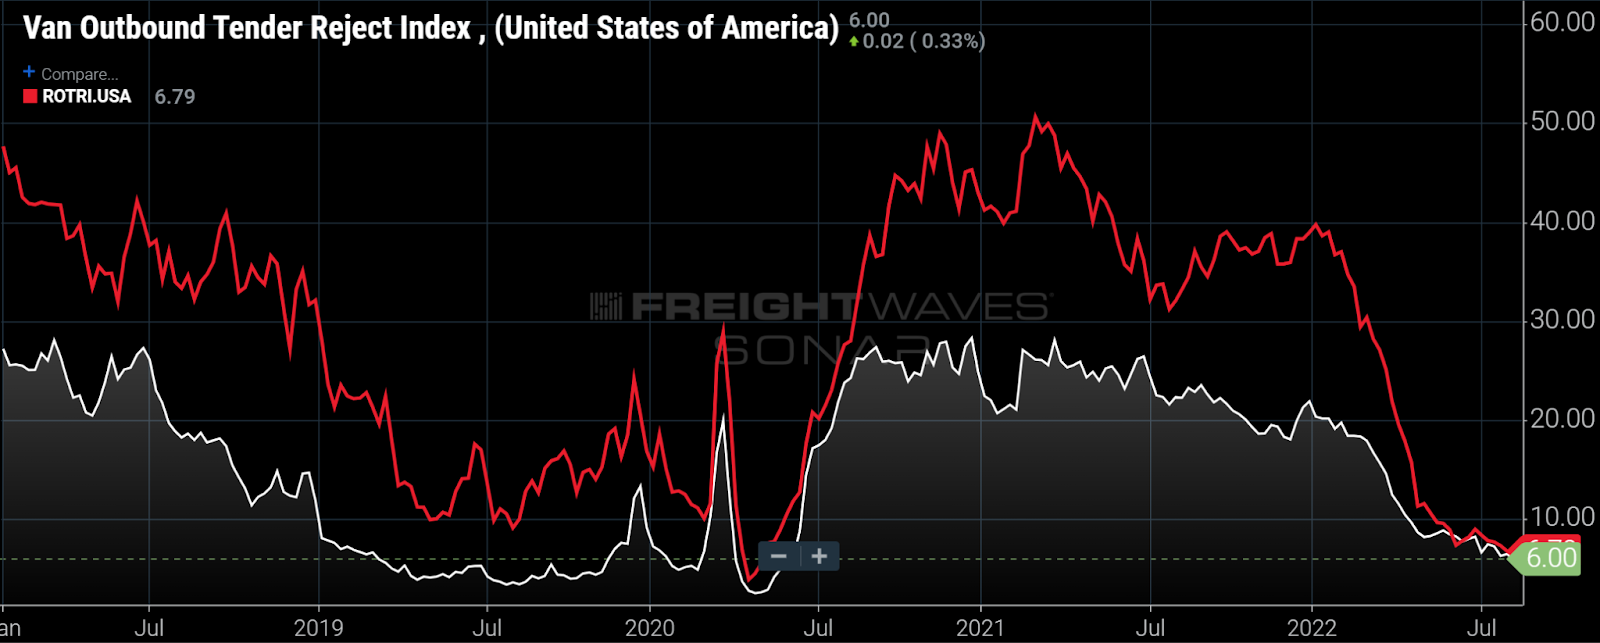
National dry van and reefer tender rejection rates are currently 6 and 6.8%, respectively, and are consistent with a deflationary freight rate environment. At the beginning of this year, those rates were around 20% and 40%, respectively.
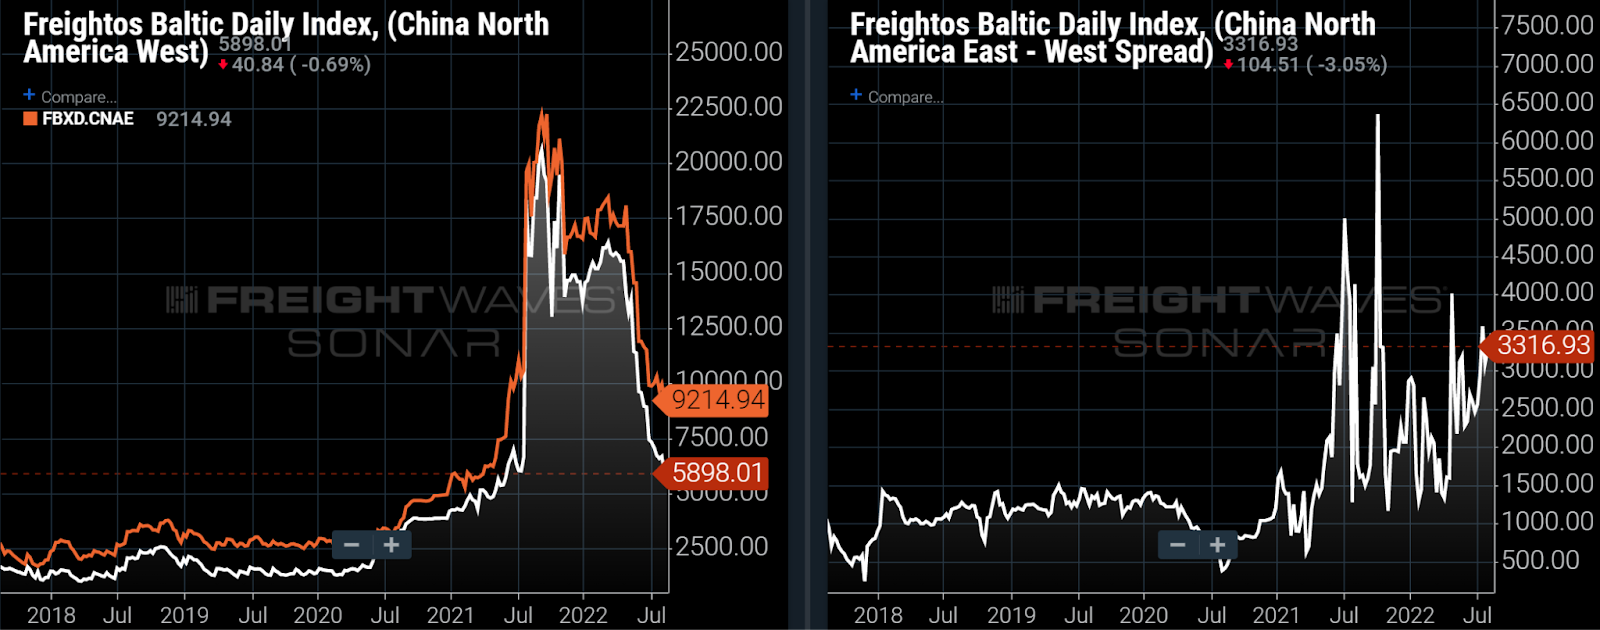
Ocean rates have fallen in recent months in the trans-Pacific lanes from China to the U.S. (above left). Rates have declined more sharply from China to the U.S. West Coast (white line) than from China to the U.S. East Coast (orange line), resulting in a higher spread (right chart above). Those rates suggest that some shippers have opted to avoid the West Coast to avoid congestion (though eastern ports have become more congested). In addition, many shippers have become less willing to pay a premium to transport goods in the quickest manner from China to U.S. consumption centers in the East and Midwest, which involves using the west coast ports and a domestic transportation “land bridge.”
To subscribe to The Stockout, FreightWaves’ CPG supply chain newsletter, please click here.
Source: freightwaves - CPGs grapple with uncertain consumer behavior
Editor: Michael Baudendistel