Freight News:
California’s loss is Texas’ gain
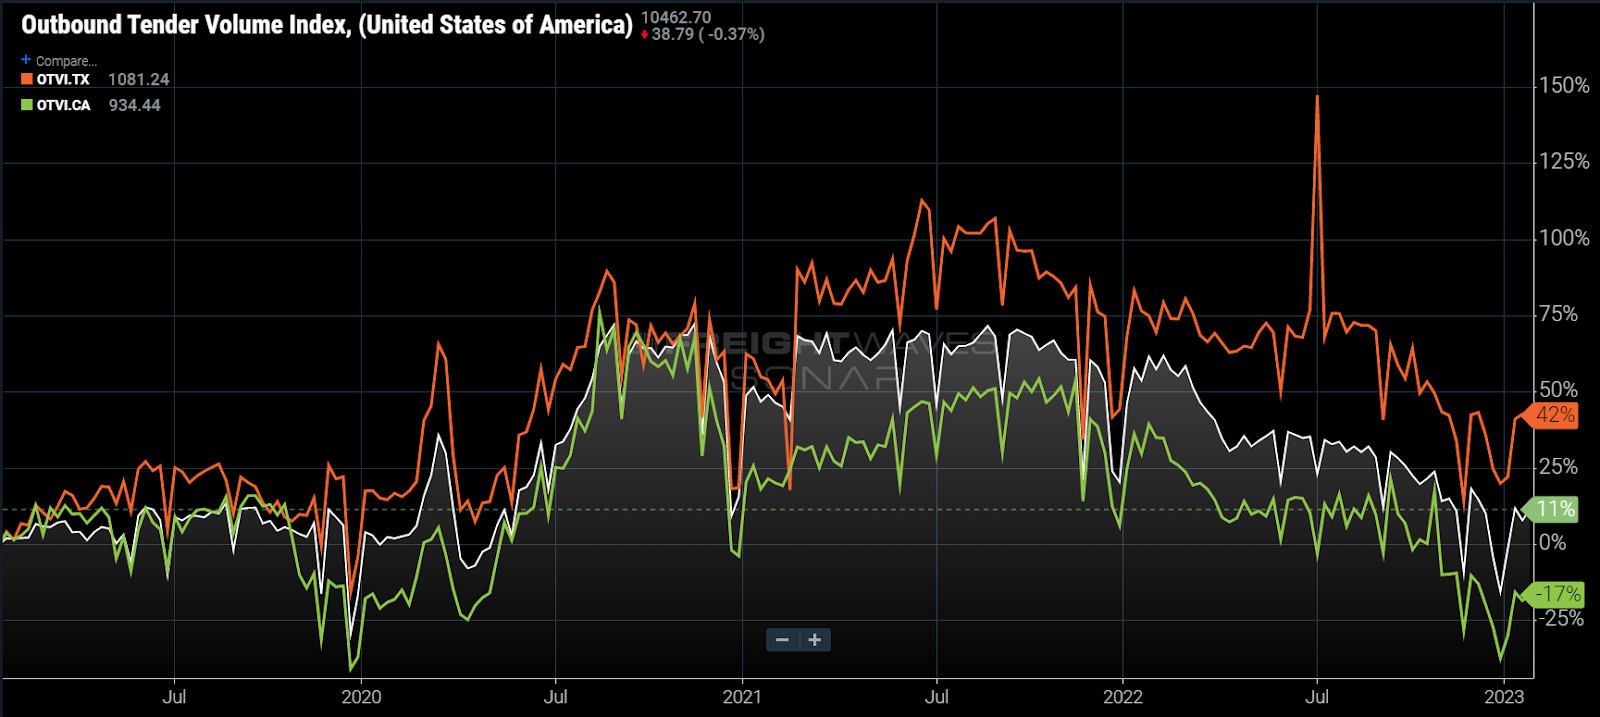
Chart of the Week: Outbound Tender Volume Index – USA, Texas, California SONAR: OTVI.USA, OTVI.TX, OTVI.CA
Tender volumes for loads originating in Texas are currently 42% higher than they were in late January 2019. In sharp contrast, California freight demand is 17% below where it was three years ago, before the pandemic started. This is a clear example of supply chains shifting, but is it long term?
The Outbound Tender Volume Index (OTVI) measures total electronic requests by shipper to carrier or broker for truckload capacity. Its primary purpose is to illustrate demand for trucking. The chart above compares the OTVI for the nation, Texas and California in a relative view, meaning it measures the percent change from the starting point — in this case Jan. 26, 2019.
Possibly surprising to some, national demand for truckload capacity remains 11% higher than it was in January 2019, considered a relatively soft period for domestic freight movement. This figure simply sets the baseline for measuring demand changes.
Shifting imports
One factor that may explain Texas’ demand growth relative to California is the shifting of imports to the U.S. East Coast that occurred this past year due to the port congestion created during COVID.
In January 2019, over 36% of the maritime imported freight came through the ports of Los Angeles and Long Beach — the current value is around 30%. The deterioration in market share is a direct result of port congestion created by the pandemic ordering frenzy.
During the height of the early pandemic ordering spree in late 2020, over 40% of the imported containers came through the Southern California ports. Pair that with a 30% increase in twenty-foot equivalent units being processed in total and the infrastructure was overwhelmed, leading to a multiyear backlog of ships waiting outside the ports that only recently cleared.
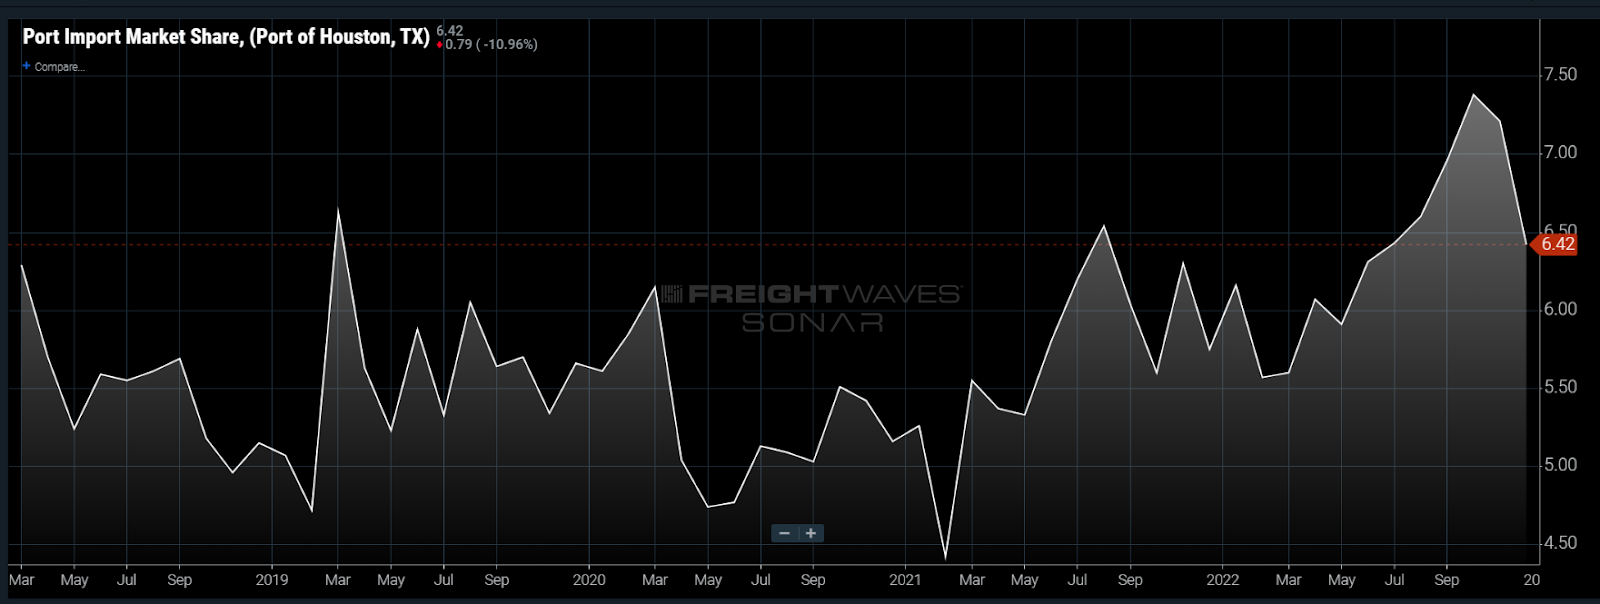
Importers attempted to alleviate the backlog and bypass the congestion in the West by diverting shipments to ports on the East Coast. Port Houston grew its import shipment market share from 5% in January 2019 to 7.3% this past October. That value fell back to 6.4% in December.
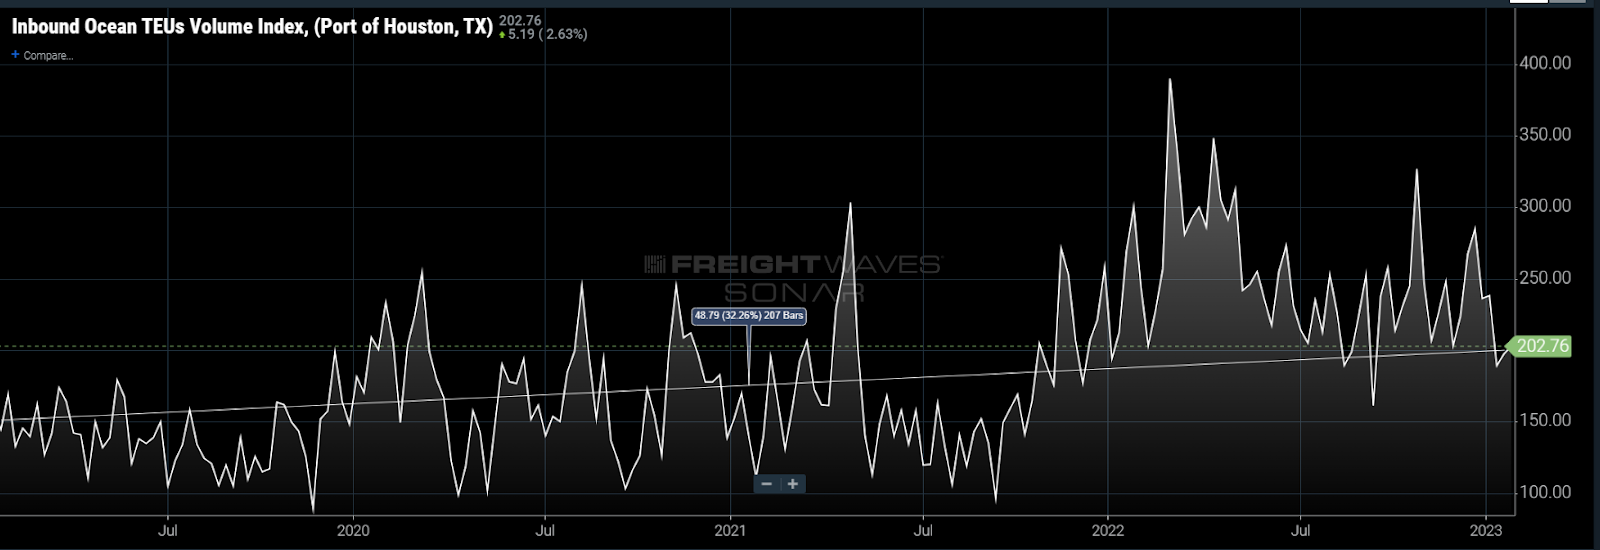
It should be noted that bookings data supports continued elevation in import volumes compared to 2019. Import bookings for container shipments bound for Port Houston are 30% higher than in 2019.
Nearshoring
While the import shift is pretty clearly illustrated in the data, the idea that companies have shifted their domestic distribution networks is muddier. Nearly the entire increase in domestic freight demand appears to be explained by the increase in import activity, but it still falls a little short. Nearshoring may be the plug that solves the equation.
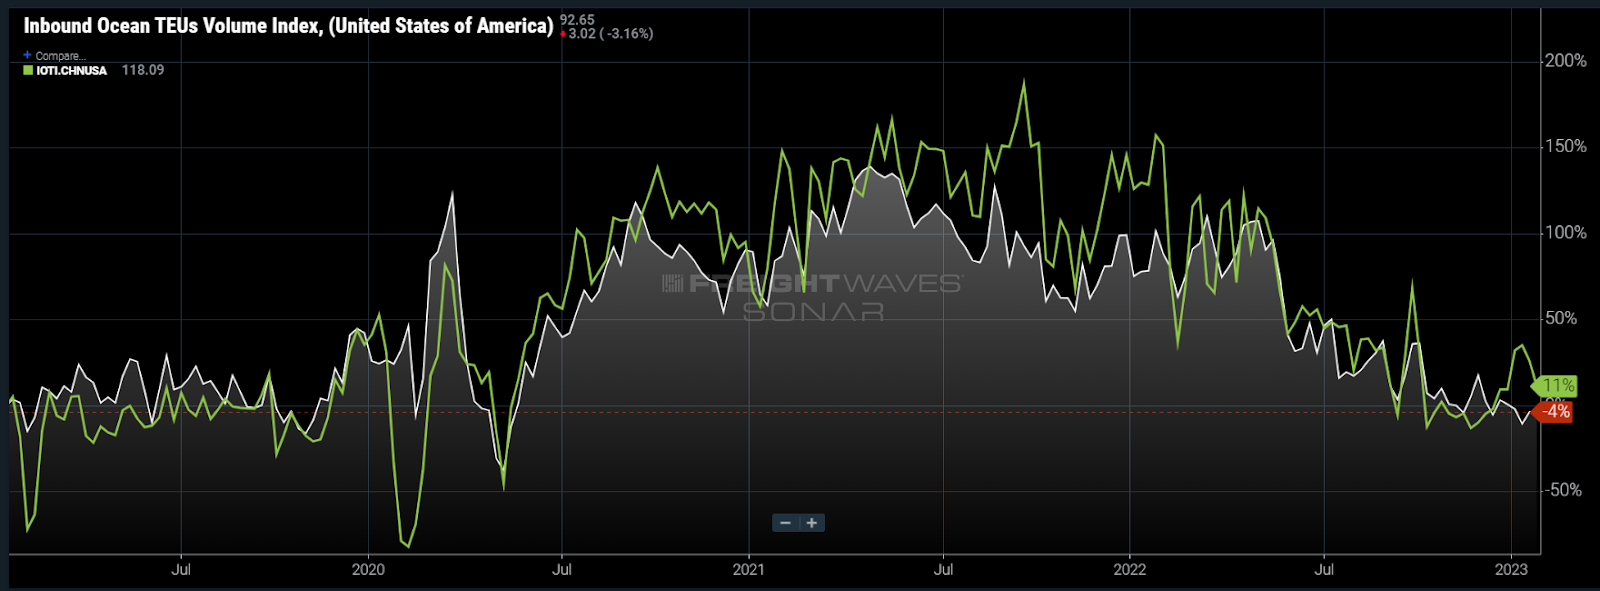
When looking at the imports coming from China, where most of the imported finished goods originate, there is not a significant drop-off in TEU bookings. In fact, it appears that volumes have grown in coming from China when compared with 2019 levels — 11% higher than late January 2019 currently. Overall import bookings are down ~4% over the same period.
This does not necessarily rule out some level of nearshoring activity, but it does not support the idea that China is being replaced as the major production center for U.S. manufacturing.
Building out infrastructure for manufacturing in North America that would replace Asian outputs would take yearst. Texas is certainly prime geography for being a centralized distribution center location for North American supply chains.
California is still the second-largest outbound state in the country; Texas is No. 1. This is a dramatic change from just over a year ago. This will be a key trend to watch in the coming months for transportation providers who have to deal not only with waning demand but with shifting networks as well.
About the Chart of the Week
The FreightWaves Chart of the Week is a chart selection from SONAR that provides an interesting data point to describe the state of the freight markets. A chart is chosen from thousands of potential charts on SONAR to help participants visualize the freight market in real time. Each week a Market Expert will post a chart, along with commentary, live on the front page. After that, the Chart of the Week will be archived on FreightWaves.com for future reference.
SONAR aggregates data from hundreds of sources, presenting the data in charts and maps and providing commentary on what freight market experts want to know about the industry in real time.
The FreightWaves data science and product teams are releasing new datasets each week and enhancing the client experience.
To request a SONAR demo, click here.
The post California’s loss is Texas’ gain appeared first on FreightWaves.
Source: freightwaves - California’s loss is Texas’ gain
Editor: Zach Strickland, FW Market Expert & Market Analyst