Freight News:
Business as usual?
This week’s FreightWaves Supply Chain Pricing Power Index: 35 (Shippers)
Last week’s FreightWaves Supply Chain Pricing Power Index: 35 (Shippers)
Three-month FreightWaves Supply Chain Pricing Power Index Outlook: 35 (Shippers)
The FreightWaves Supply Chain Pricing Power Index uses the analytics and data in FreightWaves SONAR to analyze the market and estimate the negotiating power for rates between shippers and carriers.
This week’s Pricing Power Index is based on the following indicators:
Inflation gets a jolt from energy prices
Volumes are proceeding along seasonal trends, even though some shippers are warning that the freight industry is moving “deeper into limbo.” After struggling to offload a massive inventory glut over the past few years, shippers have largely completed their destocking efforts and are now broadly looking to be leaner in the months to come. Given the surplus of available capacity, shippers are more confident in switching to “just-in-time” freight strategies as consumer resilience remains an open question.
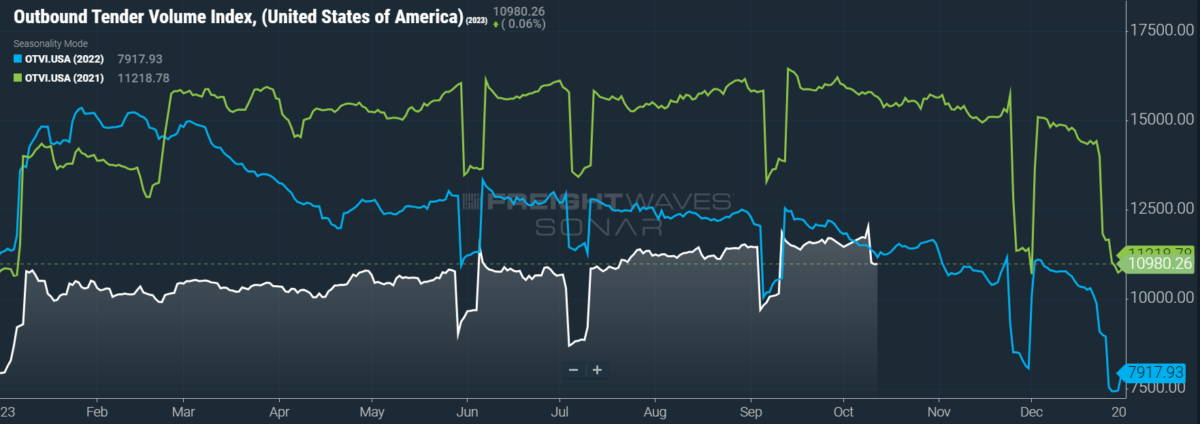
SONAR: OTVI.USA: 2023 (white), 2022 (blue) and 2021 (green)
To learn more about FreightWaves SONAR, click here.
This week, the Outbound Tender Volume Index (OTVI), which measures national freight demand by shippers’ requests for capacity, dipped 5.11% month over month (m/m). On a year-over-year (y/y) basis, OTVI is down 1.74%, though such y/y comparisons can be colored by significant shifts in tender rejections. OTVI, which includes both accepted and rejected tenders, can be inflated by an uptick in the Outbound Tender Reject Index (OTRI).
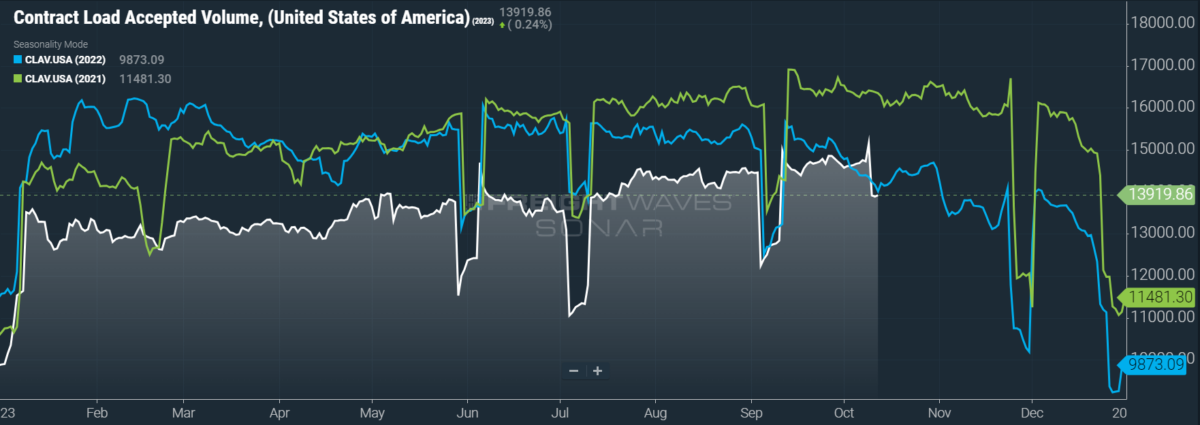
SONAR: CLAV.USA: 2023 (white), 2022 (blue) and 2021 (green)
To learn more about FreightWaves SONAR, click here.
Contract Load Accepted Volume (CLAV) is an index that measures accepted load volumes moving under contracted agreements. In short, it is similar to OTVI but without the rejected tenders. Looking at accepted tender volumes, we see a rise of 1.17% m/m as well as one of 6.44% y/y. This positive y/y difference implies that actual freight flow is recovering from this cycle’s bottom.
Despite numerous signals of a challenging business environment among labor strikes, the Bureau of Labor Statistics reported a staggering gain of 336,000 jobs in the month of September. Not only was this figure the highest monthly gain since January, but it was nearly double the 170,000-job gain of consensus expectations. Even so, the unemployment rate remained unexpectedly stable at 3.8%, frustrating predictions of a modest drop to 3.7%.
The above data should be taken with a grain of salt, however. Excepting September’s report, in which jobs data was revised upward for July and August, the headline figure has been revised lower in subsequent reports for every month of 2023 so far. Moreover, while the headline figure comes from the report’s Establishment Survey, the Household Survey reported the number of newly employed workers at just 86,000 — the second-weakest gain of 2023 to date. In this survey, the number of multiple jobholders (those employed with at least one full-time job) rose 368,000 in September, while the number of full-time jobholders fell 885,000 in the month.
Speaking of beating expectations, the September print of the Consumer Price Index revealed inflation to be slightly hotter than consensus forecasts. Headline inflation rose 0.4% over August and 3.7% y/y, with the biggest gains unsurprisingly seen in energy commodities like gasoline and fuel oil. Shelter prices, meanwhile, remain up an eye-watering 7.2% y/y, with hikes spread evenly among renters and homeowners. Yet, excluding food and energy, goods prices actually fell 0.5% y/y. Assuming that consumers have enough left in their budgets after spending on essentials, the holiday shopping season could be more active than some bears predict.
Rising energy prices were also behind September increases in supply-side inflation. The latest print of the Producer Price Index saw the headline final demand index rise 0.5% over August and 2.2% y/y, the latter of which is the largest increase since April. Producers’ input costs for food, however, was another contributing factor to inflation as the index for final demand food was up 0.9% over the previous month. Given that supply-side inflation takes roughly six months to trickle down to the consumer, these latest figures are an upsetting omen that price pressures might be too stubborn to allow for a “soft landing” — that is, taming inflation without triggering a recession.
Yet the Federal Reserve is largely unconcerned with September’s data from both the hotter-than-expected labor market and inflationary pressures. This week, several top Fed officials signaled that the sustained rise in long-term interest rates is likely to negate any need for the Fed to continue raising short-term interest rates. Thus, although the Fed was expected to introduce a final hike at one of its two meetings left in 2023, monetary policy might already be at its tightest for this cycle.
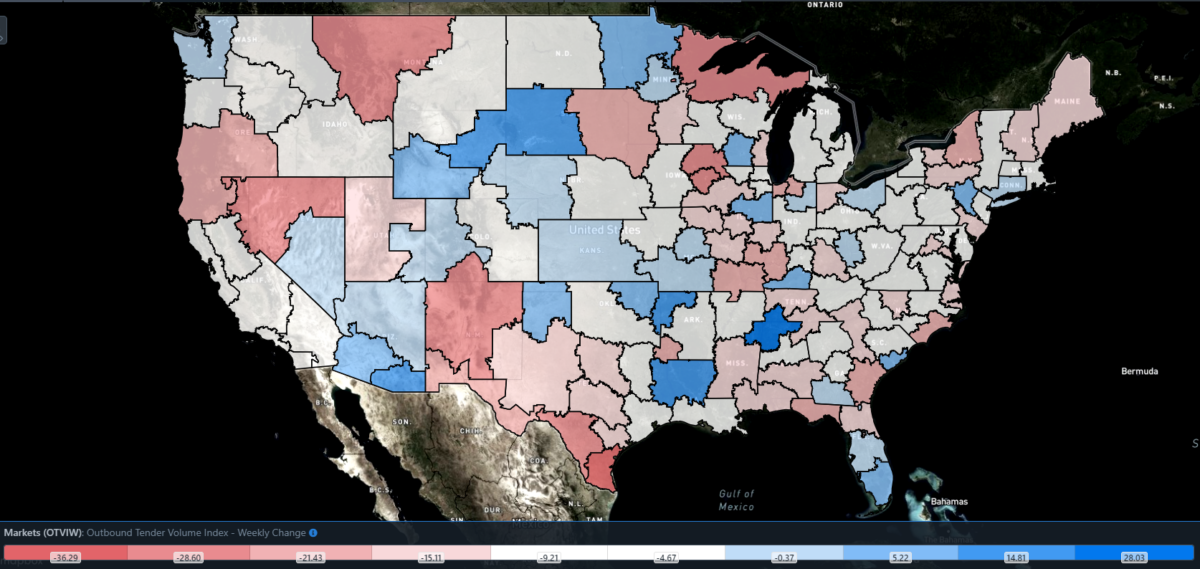
SONAR: Outbound Tender Volume Index – Weekly Change (OTVIW).
To learn more about FreightWaves SONAR, click here.
Of the 135 total markets, 29 reported week-over-week (w/w) increases in tender volumes, with the largest gains being confined mostly to the smallest markets.
Carriers’ savings run thin
Rejection rates ticked up in the prelude to Amazon’s Prime Big Deal Days, which put some brief pressure on competing retailers to secure capacity. OTRI experienced a similar uptick in July around Amazon’s Prime Day event, with those gains being lost quickly in the following week. So it seems with the current rise, as OTRI is already sliding back to its levels of mid- to late September.
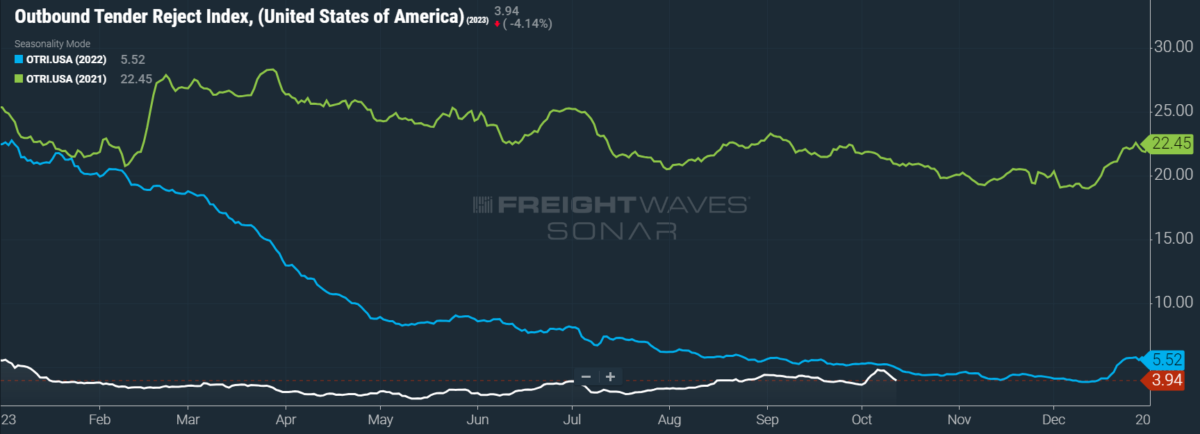
SONAR: OTRI.USA: 2023 (white), 2022 (blue) and 2021 (green)
To learn more about FreightWaves SONAR, click here.
Over the past week, OTRI, which measures relative capacity in the market, fell to 3.94%, a change of 57 basis points from the week prior. OTRI is now 99 bps below year-ago levels, with y/y comparisons becoming more favorable even if OTRI just remains stable.
Carrier bankruptcies continue to surface intermittently in 2023. The latest such victim is Meadow Lark Transport, a 40-year-old carrier with 273 drivers and 337 power units. The company’s brokerage arm saw its authority involuntarily revoked back in August, while its contract carrier authority is scheduled to be canceled by the end of October. Though there has been no official statement given as to why the company is closing, some carriers that ran loads under the company’s brokerage arm allege that they have yet to be paid. A former truck driver employed by the company also filed a class-action lawsuit in June 2022, citing a failure to disclose material facts about the economics of its lease program. Per the lawsuit, drivers in this program “often had little or no compensation and sometimes even owed Meadow Lark money despite the long hours they worked as drivers.”
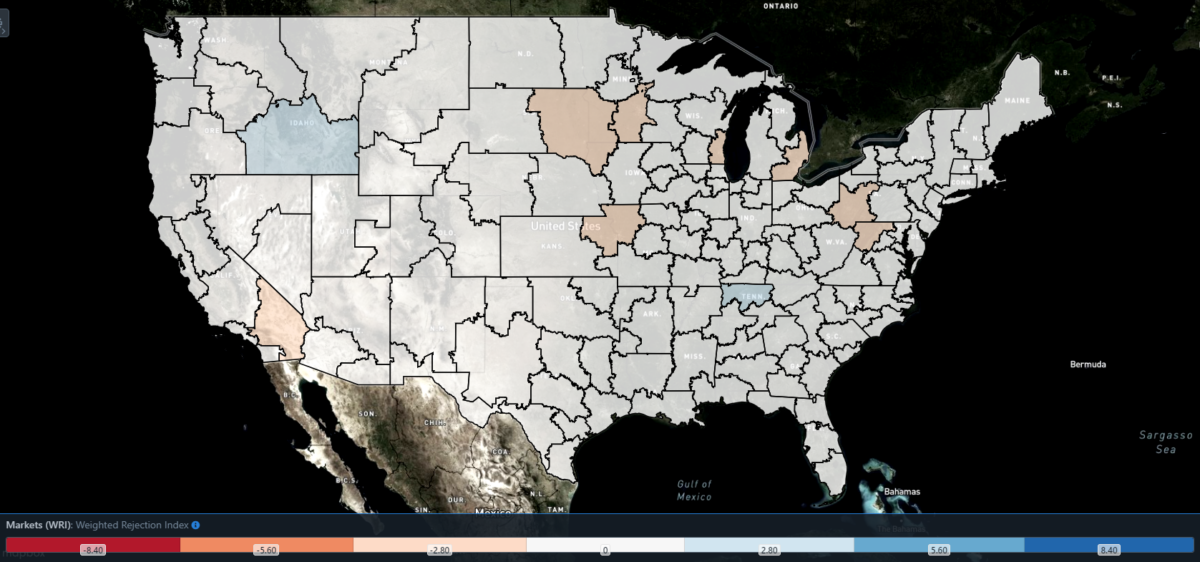
SONAR: WRI (color)
To learn more about FreightWaves SONAR, click here.
The map above shows the Weighted Rejection Index (WRI), the product of the Outbound Tender Reject Index – Weekly Change and Outbound Tender Market Share, as a way to prioritize rejection rate changes. As capacity is generally finding freight this week, only a few regions posted blue markets, which are usually the ones to focus on.
Of the 135 markets, 55 reported higher rejection rates over the past week, though 31 of those saw increases of only 100 or fewer bps.
Motion sickness
Crude oil prices, which directly inform prices of diesel and gasoline, have been on quite the ride over the past few weeks. In late September, oil prices rallied among fears of a growing imbalance between supply and demand. This rally came to an abrupt end, however, as the U.S. reported a significant build of gasoline stocks and fears of a recession outweighed those of a supply shortfall. Unrest in the Middle East then shook up oil markets once again, though the latest rise was primarily brought about by the U.S.’ sanctioning of two tanker owners carrying Russian oil above the G7-mandated price cap of $60 per barrel.
Where does this roller coaster leave diesel prices? Although oil’s current rally appears to be ultimately limited by recessionary fears, diesel is a refined product downstream of oil trading. In order to compensate for this lag in market exposure, diesel prices are likely to remain stickier at a higher level, offsetting any potential volatility incurred by geopolitical chaos. Such potential for upward pressure, however, has yet to be realized as retail diesel prices continue to slide from late September’s peak.
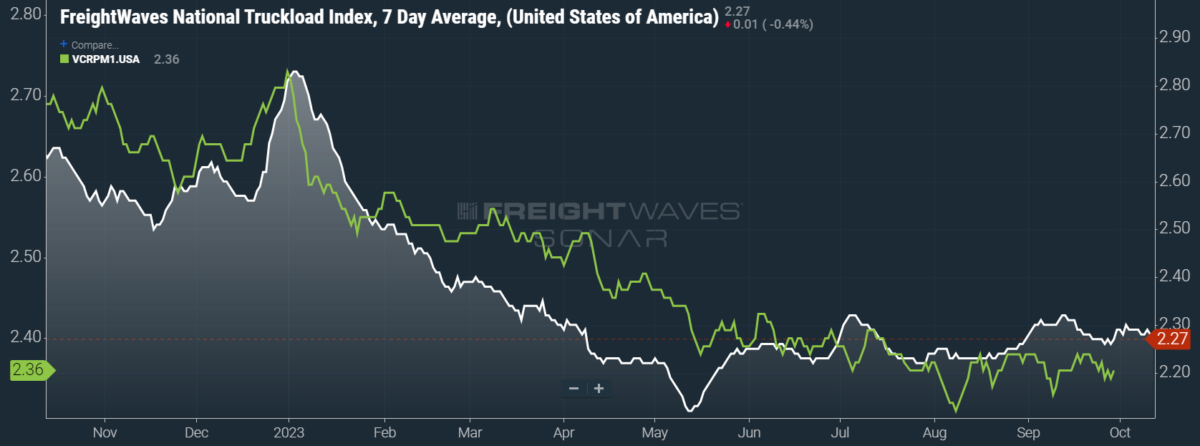
SONAR: National Truckload Index, 7-day average (white; right axis) and dry van contract rate (green; left axis).
To learn more about FreightWaves SONAR, click here.
This week, the National Truckload Index (NTI) — which includes fuel surcharges and other accessorials — fell 2 cents per mile to $2.27. Sliding linehaul rates were only half responsible for this decline, as the linehaul variant of the NTI (NTIL) — which excludes fuel surcharges and other accessorials — fell 1 cent per mile w/w to $1.58.
Contract rates, which are reported on a two-week delay, have seen their fair share of volatility over the past few weeks as well. Compared to where they started the third quarter, contract rates have only fallen 3 cents per mile, though this summary ignores some extreme dips from early August and September. In the coming weeks, we will start to see how aggressive shippers were in negotiating Q4 freight contracts. For the time being, contract rates — which exclude fuel surcharges and other accessorials like the NTIL — are down 1 cent per mile w/w at $2.36.
To learn more about FreightWaves SONAR, click here.
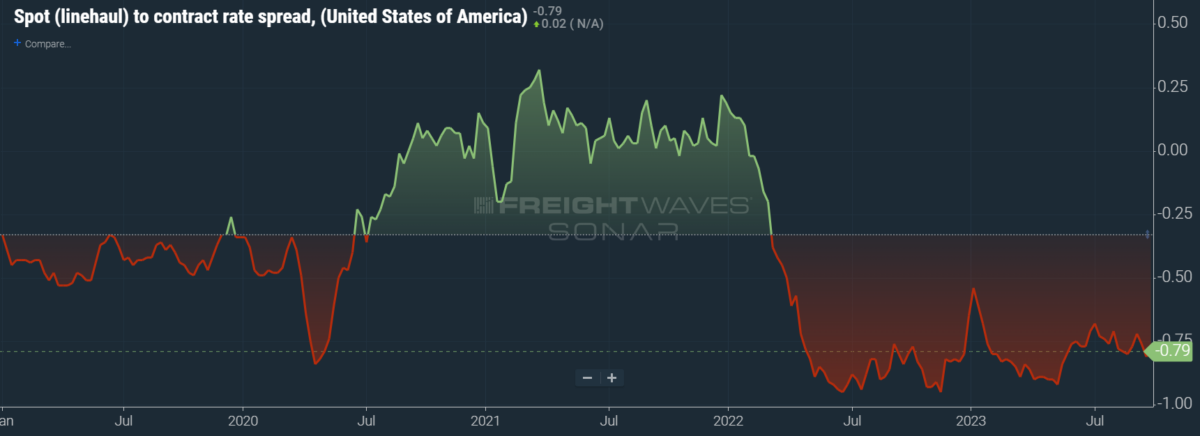
The chart above shows the spread between the NTIL and dry van contract rates, revealing the index has fallen to all-time lows in the data set, which dates to early 2019. Throughout that year, contract rates exceeded spot rates, leading to a record number of bankruptcies in the space. Once COVID-19 spread, spot rates reacted quickly, rising to record highs seemingly weekly, while contract rates slowly crept higher throughout 2021.
Despite this spread narrowing significantly early in the year, tightening by 20 cents per mile in January, it has widened again throughout the year to date. As linehaul spot rates remain 79 cents below contract rates, there is still plenty of room for contract rates to decline — or for spot rates to rise — in the remainder of the year.
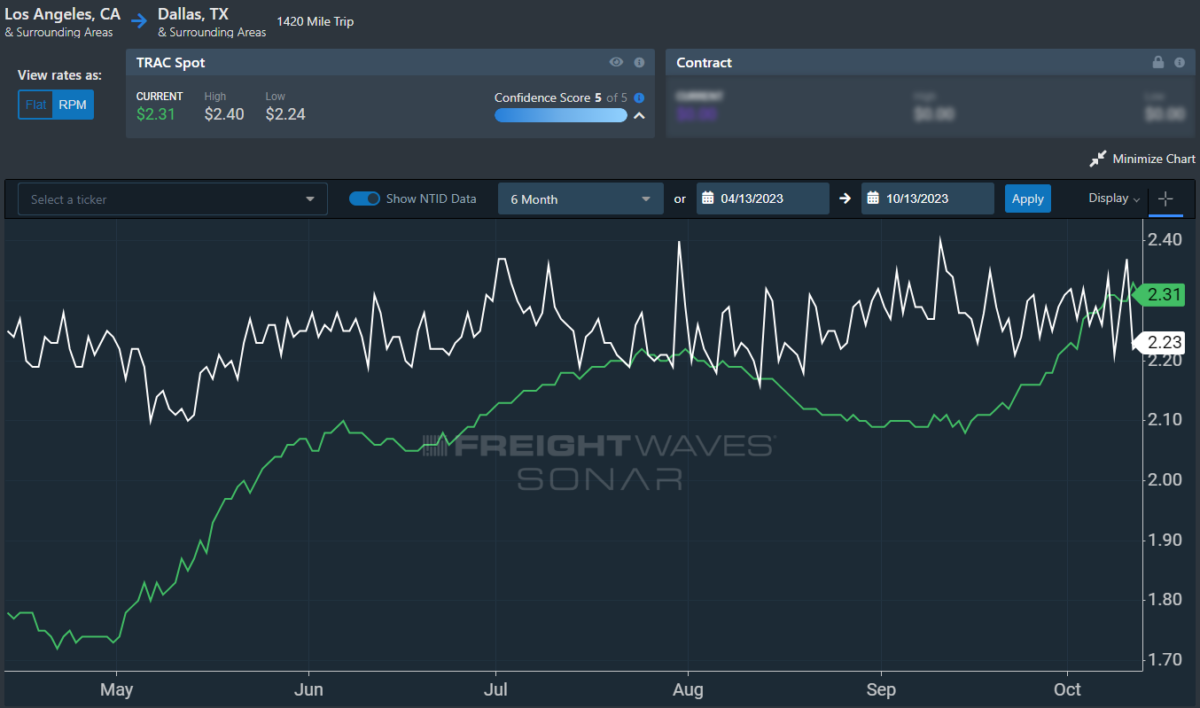
To learn more about FreightWaves TRAC, click here.
The FreightWaves Trusted Rate Assessment Consortium (TRAC) spot rate from Los Angeles to Dallas, arguably one of the densest freight lanes in the country, is finding its footing once again. Over the past week, the TRAC rate rose 3 cents per mile to $2.31 — still some distance from its year-to-date high of $2.39. The daily NTI (NTID), which has fallen to $2.23, is finally being outpaced by rates along this lane.
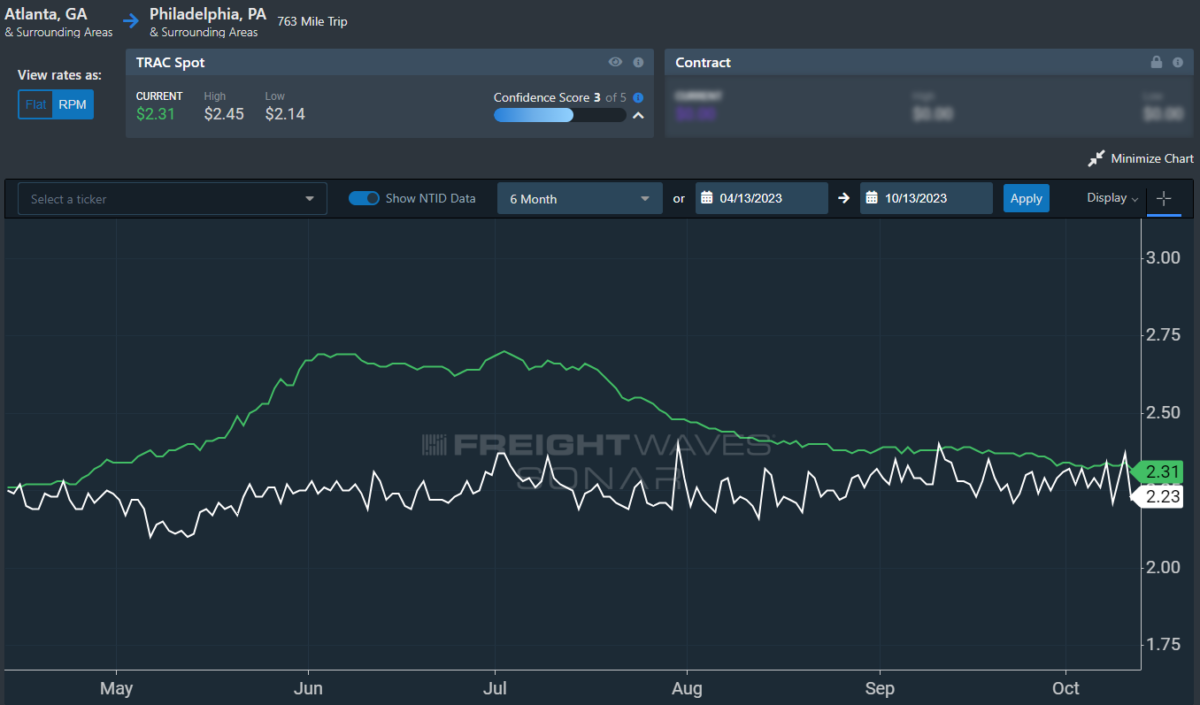
To learn more about FreightWaves TRAC, click here.
On the East Coast, especially out of Atlanta, rates have come down from July’s early peak but are still outpacing the NTID. The FreightWaves TRAC rate from Atlanta to Philadelphia fell 2 cents per mile to $2.31. After a bull run that started at the end of April, this lane had been plateauing above the national average, which made north-to-south lanes in the East more attractive than West Coast alternatives.
For more information on FreightWaves’ research, please contact Michael Rudolph at mrudolph@freightwaves.com or Tony Mulvey at tmulvey@freightwaves.com.
The post Business as usual? appeared first on FreightWaves.
Source: freightwaves - Business as usual?
Editor: Michael Rudolph