Freight News:
Bottom’s up!
This week’s FreightWaves Supply Chain Pricing Power Index: 30 (Shippers)
Last week’s FreightWaves Supply Chain Pricing Power Index: 25 (Shippers)
Three-month FreightWaves Supply Chain Pricing Power Index Outlook: 30 (Shippers)
The FreightWaves Supply Chain Pricing Power Index uses the analytics and data in FreightWaves SONAR to analyze the market and estimate the negotiating power for rates between shippers and carriers.
This week’s Pricing Power Index is based on the following indicators:
The beauty wore of promise
Given the federal holiday on Tuesday of last week, freight demand metrics face extremely favorable comps on a week-over-week (w/w) basis. Instead, a better method of tracking relative growth in tender volumes would be to compare current readings against those from two weeks ago.
Within this framework, we see a surprising and hopeful trend: Freight demand grew on a two-week basis. Such growth was not seen last July, when freight markets were in decline, nor in 2021 — arguably the best year for truckload volumes on record — nor even in 2020, when shippers scrambled to push loads amid a pandemic-era swell in consumer demand. In fact, such growth has not been seen since July 2019, when the industry was steadily recovering from a lingering recession.

SONAR: OTVI.USA: 2023 (white), 2022 (blue) and 2021 (green)
To learn more about FreightWaves SONAR, click here.
This week, the Outbound Tender Volume Index (OTVI), which measures national freight demand by shippers’ requests for capacity, rose 1.81% on a two-week basis. On a year-over-year (y/y) basis, OTVI is down 14.16%, though such y/y comparisons can be colored by significant shifts in tender rejections. OTVI, which includes both accepted and rejected tenders, can be inflated by an uptick in the Outbound Tender Reject Index (OTRI).
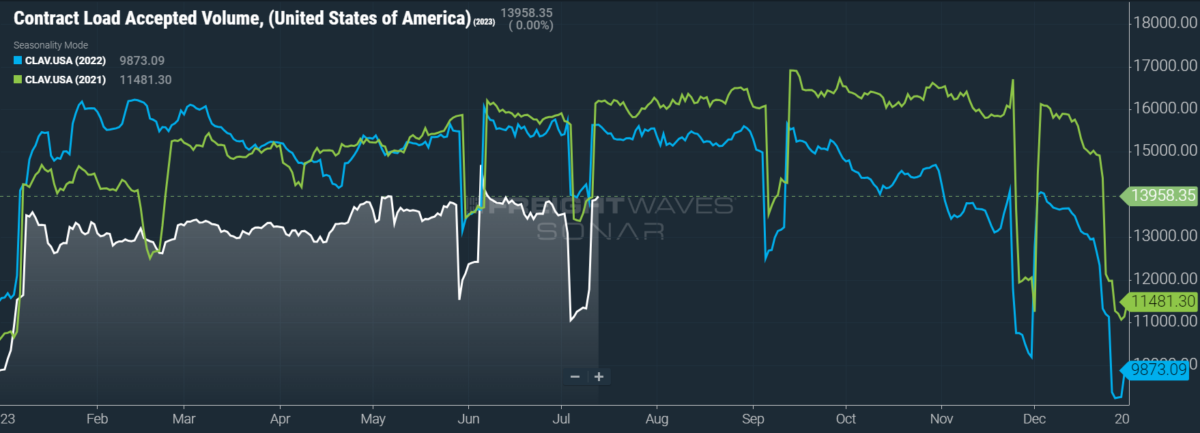
SONAR: CLAV.USA: 2023 (white), 2022 (blue) and 2021 (green)
To learn more about FreightWaves SONAR, click here.
Contract Load Accepted Volume (CLAV) is an index that measures accepted load volumes moving under contracted agreements. In short, it is similar to OTVI but without the rejected tenders. Looking at accepted tender volumes, we see a gain of 2.6% on a two-week basis as well as a fall of 10.7% y/y. This y/y difference confirms that actual cracks in freight demand — and not merely OTRI’s y/y decline — are driving OTVI lower.
How does this trend of fortnightly growth bear on market conditions for the next six months? At the very least, I am hopeful (if not fully confident) that this cycle is past its bottom. But looking to 2019 for a recovery timeline will not avail us: As mentioned previously, the steady recovery we might have seen in 2020 was interrupted by a pandemic that sent consumer demand skyrocketing.
Yet in 2023, consumer demand is not likely to improve anytime soon. At the risk of beating a dead horse, October’s resumption of student loan repayments will erode consumer demand for discretionary items. More than a quarter of the labor force will be taking a haircut in the fall, one for which many have not fully planned or cannot afford. If we see weakness in the job market — which has been the last remaining pillar preventing a broad economic recession — credit markets will likely crash soon after, taking freight demand with them.
Earlier this week, the Federal Reserve released its monthly consumer credit report. In May, the total amount of revolving credit (which includes credit card debt) jumped 0.7% from April and 8.2% y/y, to $1.25 trillion. More importantly, the cost of holding such debt also increased in May, as the average interest rate on a credit card leapt from 20.92% to 22.16%. This news is a worrying indicator of future demand, or lack thereof.
At the same time, it is difficult to imagine carriers abiding worse conditions than they already have. Those carriers that were able to endure May’s recent lows are unlikely to be able to suffer yet another downturn over the next six months. Instead, such carriers will probably leave the industry altogether, putting constraints on capacity that should help rates (especially spot rates) improve. Put another way, the market has become so hostile to carriers that there is nowhere to go but up. Luckily, metrics like dry van spot rates are currently pointing toward a modest recovery.

SONAR: Outbound Tender Volume Index – Two Week Change (OTVIF) and Outbound Tender Market Share (OTMS).
To learn more about FreightWaves SONAR, click here.
Of the 135 total markets, 77 reported increases in tender volumes on a two-week basis, with healthy gains seen in large and midsize markets alike.
Turning to maritime import data, Georgia’s Port of Savannah is primed to heat up in the coming weeks. Savannah’s OTVI is already up an impressive 15.7% on a two-week basis, but more volume should be arriving at its port before long. Per FreightWaves’ Container Atlas, Savannah’s Ocean TEU Volume Index just reached a year-to-date peak at the end of June. With an average of 33 days’ transit to the Port of Savannah, this peak volume will be arriving in the first week of August, though maritime imports will continue to increase until then.
By mode: Van volumes are looking healthy, as the Van Outbound Tender Volume Index (VOTVI) is up 2% on a two-week basis. Not so for reefers: The Reefer Outbound Tender Volume Index (ROTVI) is down 3.99% over the same period. This weakness is likely caused by the void left after California’s produce season yielded low harvests after late-winter flooding.
Heading down?
Rejection rates and spot rates, which typically — though not always — benefit from holidays during which capacity is constrained, are more accurately measured on a weekly basis than otherwise. This approach is due to the nature of OTRI, which is not an absolute measure of capacity but rather tracks capacity relative to freight demand. This self-balancing aspect of OTRI makes recourse to a two-week basis somewhat irrelevant.

SONAR: OTRI.USA: 2023 (white), 2022 (blue) and 2021 (green)
To learn more about FreightWaves SONAR, click here.
Over the past week, OTRI, which measures relative capacity in the market, fell to 3.08%, a change of 20 basis points (bps) from the week prior. OTRI is now 413 bps below year-ago levels, with y/y comparisons becoming only more favorable as the year progresses.

SONAR: WRI (color)
To learn more about FreightWaves SONAR, click here.
The map above shows the Weighted Rejection Index (WRI), the product of the Outbound Tender Reject Index — Weekly Change and Outbound Tender Market Share, as a way to prioritize rejection rate changes. As capacity is generally finding freight this week, one region posted a blue market, which are usually the ones to focus on.
Of the 135 markets, 55 reported higher rejection rates over the past week, though 42 of those saw increases of only 100 or fewer bps.

To learn more about FreightWaves SONAR, click here.
By mode: Flatbed demand is getting the wind knocked out of its sails, as the Flatbed Outbound Tender Reject Index (FOTRI) is down 76 bps w/w to 8.24%. Although FOTRI has the highest reading among the three modes, its fall from grace is much more acute than the others’, having just crested near 16% at the beginning of June. But U.S. industrial activity has slowed significantly over the past year and construction seems as though it too is about to hit the brakes, leaving FOTRI with few sources of upward pressure.
Reefer rejection rates have bounced back from Monday’s recent dip below 4% but have depreciated quite a bit from June’s average. The Reefer Outbound Tender Reject Index (ROTRI) is down 6 bps w/w at 4.23%, suffering from California’s absence during its usual produce prominence. The Van Outbound Tender Reject Index (VOTRI), meanwhile, is down 23 bps w/w to 2.87%.
Stay, spot, stay!
Spot rates are the most obvious source for hope that market conditions will improve — or, at the very least, that they will not soon deteriorate further. Comparisons made on a weekly basis are quite favorable, given the boost spot rates received during last week’s constraints on capacity. It should not be surprising that spot rates fell, but it is a pleasant surprise that they remained as near to their recent peak as they did. Spot rates’ decline has been far more pronounced in previous post-holiday weeks.

SONAR: National Truckload Index, 7-day average (white; right axis) and dry van contract rate (green; left axis).
To learn more about FreightWaves SONAR, click here.
This week, the National Truckload Index (NTI) — which includes fuel surcharges and other accessorials — fell 4 cents per mile to $2.28. Falling linehaul rates were the sole culprit behind that tumble, as the linehaul variant of the NTI — NTIL, which excludes fuel surcharges and other accessorials — also fell 4 cents per mile w/w to $1.68.
Contract rates are reported on a two-week delay, but data from the end of June reveals that they first hit their quarterly bottom in mid-May, dipping down to that level a few more times in June. We are still waiting to see what the opening salvo of Q3 looks like, especially since contract rates fell briefly into a divot around last year’s Independence Day. In any case, contract rates — which exclude fuel surcharges and other accessorials like the NTIL — have remained unchanged w/w at $2.39 per mile.

To learn more about FreightWaves SONAR, click here.
The chart above shows the spread between the NTIL and dry van contract rates, revealing the index has fallen to all-time lows in the data set, which dates to early 2019. Throughout that year, contract rates exceeded spot rates, leading to a record number of bankruptcies in the space. Once COVID-19 spread, spot rates reacted quickly, rising to record highs seemingly weekly, while contract rates slowly crept higher throughout 2021.
Despite this spread narrowing significantly early in the year, tightening by 20 cents per mile in January, it has widened again throughout the year-to-date. As linehaul spot rates remain 73 cents below contract rates, there is still plenty of room for contract rates to decline — or for spot rates to rise — in the remainder of the year.

To learn more about FreightWaves TRAC, click here.
The FreightWaves Trusted Rate Assessment Consortium (TRAC) spot rate from Los Angeles to Dallas, arguably one of the densest freight lanes in the country, continues to distance itself from April’s floor. Over the past week, the TRAC rate rose 3 cents per mile to $2.18 — still a distance from its year-to-date high of $2.39. The daily NTI (NTID), which has ticked down to $2.25, continues to outpace rates along this lane.

To learn more about FreightWaves TRAC, click here.
On the East Coast, especially out of Atlanta, rates have come down from July’s early peak but are still outpacing the NTID. The FreightWaves TRAC rate from Atlanta to Philadelphia held steady w/w at $2.64. After a bull run that started at the end of April, this lane has been plateauing above the national average, which is making north-to-south lanes in the East far more attractive than West Coast alternatives.
For more information on FreightWaves’ research, please contact Michael Rudolph at mrudolph@freightwaves.com or Tony Mulvey at tmulvey@freightwaves.com.
The post Bottom’s up! appeared first on FreightWaves.
Source: freightwaves - Bottom’s up!
Editor: Michael Rudolph