Freight News:
Back despite popular demand
This week’s FreightWaves Supply Chain Pricing Power Index: 30 (Shippers)
Last week’s FreightWaves Supply Chain Pricing Power Index: 30 (Shippers)
Three-month FreightWaves Supply Chain Pricing Power Index Outlook: 35 (Shippers)
The FreightWaves Supply Chain Pricing Power Index uses the analytics and data in FreightWaves SONAR to analyze the market and estimate the negotiating power for rates between shippers and carriers.
This week’s Pricing Power Index is based on the following indicators:
Outlook darkens for industrial sector, housing markets
After a none-too-brief break, the Pricing Power Index is resuming its regular Friday schedule. To celebrate its return, we will be taking an in-depth look at a few sectors that supply domestic truckload markets with freight, in addition to the usual, topical content.
But first, a quick review of the current market. Freight demand has been remarkably constant throughout most of August, though not nearly at a level that can effect a significantly higher number of rejections, which would in turn drive higher carrier rates. For most carriers, then, this year’s peak season is one in name only. At the same time, consumer spending on retail goods is waning in the middle of August, while spending on services like entertainment and airfare is robust.
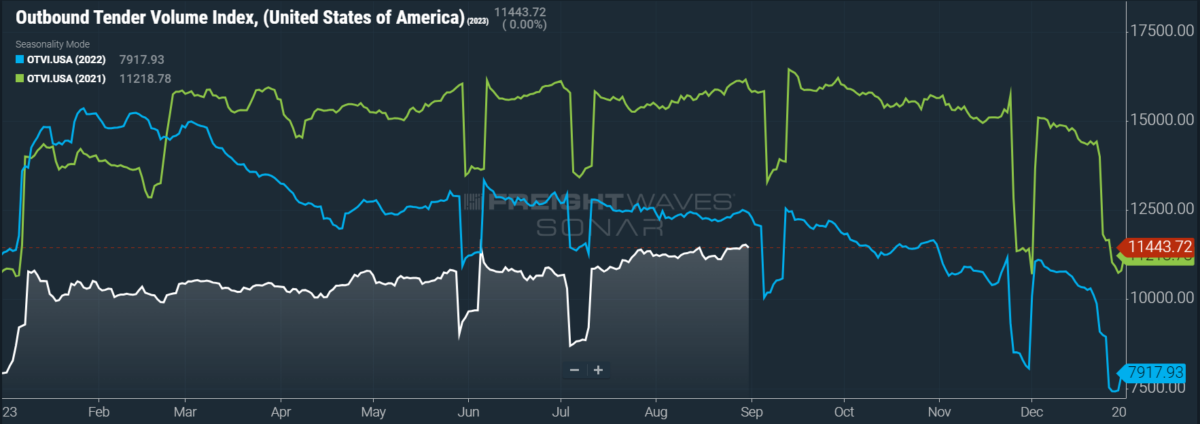
SONAR: OTVI.USA: 2023 (white), 2022 (blue) and 2021 (green)
To learn more about FreightWaves SONAR, click here.
This week, the Outbound Tender Volume Index (OTVI), which measures national freight demand by shippers’ requests for capacity, rose 0.24% on a week-over-week (w/w) basis. On a year-over-year (y/y) basis, OTVI is down 6.85%, though such y/y comparisons can be colored by significant shifts in tender rejections. OTVI, which includes both accepted and rejected tenders, can be inflated by an uptick in the Outbound Tender Reject Index (OTRI).
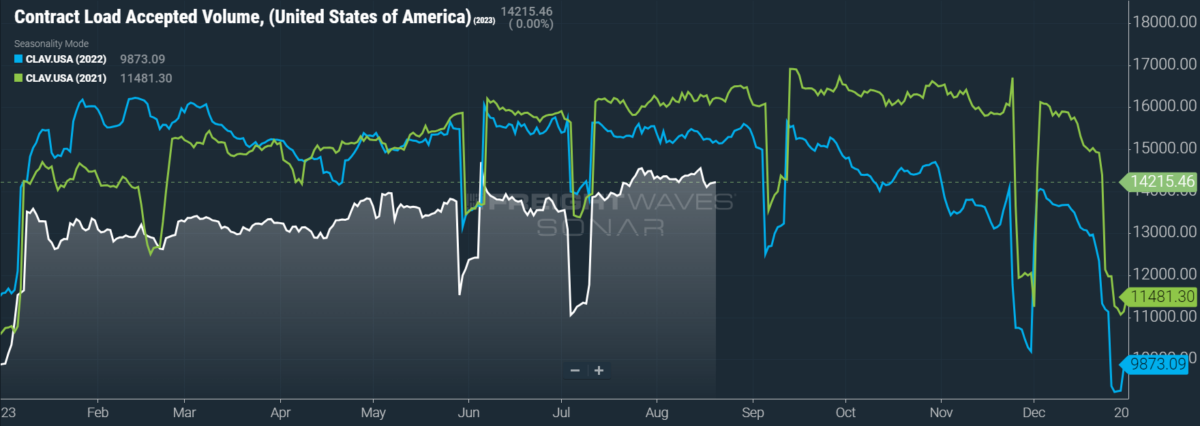
SONAR: CLAV.USA: 2023 (white), 2022 (blue) and 2021 (green)
To learn more about FreightWaves SONAR, click here.
Contract Load Accepted Volume (CLAV) is an index that measures accepted load volumes moving under contracted agreements. In short, it is similar to OTVI but without the rejected tenders. Looking at accepted tender volumes, we see a rise of 1.82% w/w as well as a fall of 6.37% y/y. This y/y difference confirms that actual cracks in freight demand — and not merely OTRI’s y/y decline — are driving OTVI lower.
The domestic industrial sector, a key supplier of freight to flatbed and LTL carriers, is broadcasting somewhat mixed signals. Following two months of decline, industrial production rose 1% on a month-over-month (m/m) basis in July, while manufacturing ticked up 0.5% m/m. Yet the general consensus among manufacturers is that the sector is suffering an obvious downturn, albeit a mild one that has yet to have severe consequences on the broader economy. Federal spending, such as can be seen in the CHIPS and Science Act as well as the Inflation Reduction Act, is keeping the floor of industrial activity high, while heavy divestiture from China and East Asia promises long-term security for domestic manufacturing.
Yet the real life-saver in the industrial sector is also threatening to sink the ship. In July, production of motor vehicles and parts jumped 5.2% m/m. The auto industry is benefiting from a robust mix of market share among light trucks (including SUVs and crossovers) and electric vehicles. Such diversification of offerings’ market share tends to yield increased resilience to sudden shifts in consumer health or demand.
Good news aside, consumer demand for autos is still threatened by high interest rates, still-elevated inflation and weak consumer confidence. Delinquencies on auto loans by 60 or more days were up 15.7% y/y in July, with nearly 7% of subprime loans in severe delinquency. For comparison’s sake, delinquencies on subprime auto loans hovered around 5% during the 2007-2008 financial crisis.
But the most alarming signal by far is the growing potential for a strike among 150,000 members of the United Auto Workers (UAW), a labor union currently negotiating contracts for hourly workers at the Detroit Three automakers: Ford, General Motors and Stellantis (formerly Chrysler). Taking cues from recent actions by other union leaders, UAW President Shawn Fain has framed the negotiations in bellicose terms, ready to declare “war” on the Detroit Three if their demands — such as a 46% raise, a return to traditional pension plans and a 32-hour work week — are not accepted by Sept. 14. It goes without saying that if this strike comes to pass, it would limit auto production and put additional pressure on auto prices, further risking the disinflationary “soft landing” hoped for by the Federal Reserve.
Speaking of which, there is a growing possibility that the Fed’s tightening cycle has already reached its peak. At their annual symposium in Jackson Hole, Wyoming, Fed officials were cautiously optimistic that their fight against inflation could soon be set to cruise control, as a rise in long-term Treasury yields will weigh heavily on price increases for the foreseeable future. One such way in which these government bond yields encourage disinflation is by their influence on the average 30-year mortgage rate, which — at a fixed rate of 7.23% — recently hit its highest level since 2001.
High mortgage rates have two primary effects on the trucking industry. Elevated mortgage rates dissuade homeowners from putting their houses on the market, as they would abandon their current low-rate mortgages for ones at historic highs. If demand for housing exceeds supply, this imbalance encourages homebuilders to begin construction on new homes. Accordingly, single-family housing starts leapt 6.7% m/m and 9.5% y/y in July. With demand from the construction sector comes demand for flatbeds to haul lumber and steel.
But this rash of new construction is a double-edged sword that cuts more deeply the longer that mortgage rates remain high. First, would-be homeowners will eventually tap out and stick to renting; per recent data from the Mortgage Bankers Association, applications for home purchase mortgages fell to their lowest levels since 1995. The imbalance between housing supply and demand can just as easily be righted by waning demand rather than increasing supply.
The other effects of new construction gaining share in the housing market are more subtle and wide-reaching. As new homes are more expensive to buy, demand for furniture and other durable goods that would otherwise accompany a purchase is weakened. Consumers are likely to downshift their spending to Ikea as opposed to Pottery Barn, for example — if they don’t forgo bed frames altogether and choose to keep their mattresses on the floor. Furthermore, DIY projects that drive spending at home improvement retailers are less numerous if the purchased home is new.
To summarize, high mortgage rates sustained over a period of time should provide short-term boosts to flatbed demand, but dry van volumes will suffer from a decline in spending on durable goods like furniture and home appliances. As mortgage rates continue to transform the dream of homeownership into an unaffordable nightmare, flatbed volumes from construction materials will suffer in the longer run.
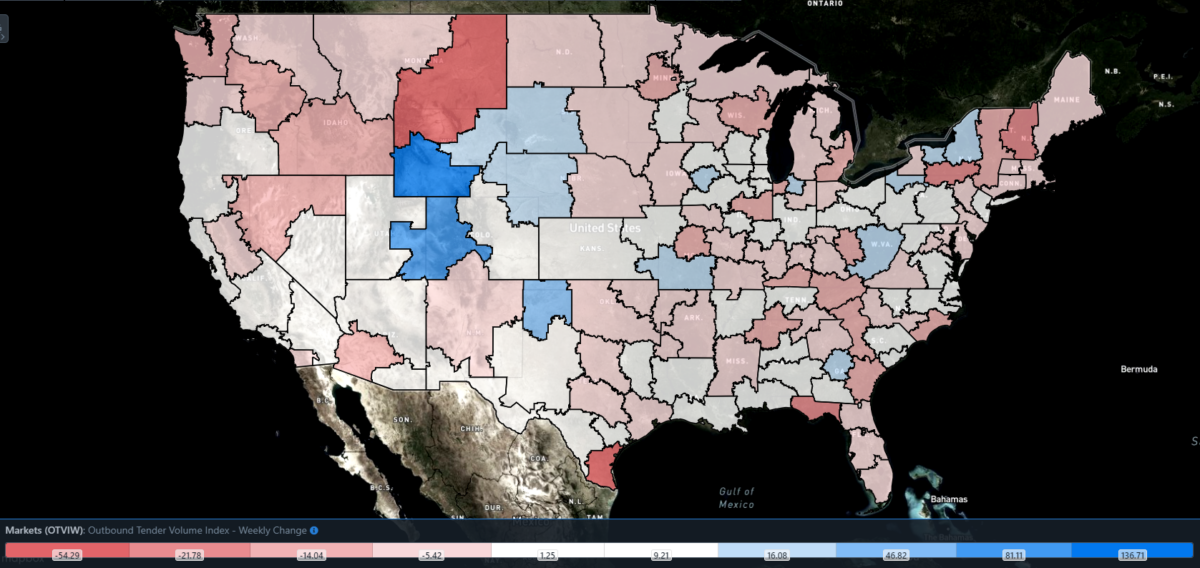
SONAR: Outbound Tender Volume Index – Weekly Change (OTVIW).
To learn more about FreightWaves SONAR, click here.
Of the 135 total markets, 72 reported weekly increases in tender volumes, although most of the major markets found themselves exempt from such gains.
California’s heavyweight Ontario market, which houses a majority of the warehouses and distribution centers that handle imports from the nearby ports of Long Beach and Los Angeles, saw a modest gain in freight demand of 1.9% w/w. Increased activity at the ports in August has allowed Ontario to unseat Atlanta as the nation’s busiest market by outbound volume.
By mode: Reefer volumes rallied throughout August, thanks in large part to heat waves across the country that compelled shippers to switch modes and protect their freight against extreme temperatures. The Reefer Outbound Tender Volume Index (ROTVI) has jumped 4.7% w/w and 12.9% over July. Perhaps most impressively, ROTVI is up 1.8% y/y. As cooler weather prevails in the coming months, it is unclear whether reefers will continue to show this level of strength.
Van volumes, meanwhile, are not showing the same resilience as reefers are but are still seeing incremental gains in line with seasonal trends. The Van Outbound Tender Volume Index (VOTVI) is up 0.14% w/w and 1.3% over July. Even so, VOTVI is down 5.5% y/y given the deterioration of van rejection rates over that same period.
Bloodletting
Rejection rates have taken off since the middle of August, currently sitting at their highest level since January. Since freight demand has not risen at such a quick pace, we can infer that carriers are beginning to leave the marketplace. However, the trucking industry is highly fragmented and so the majority of carrier bankruptcies will pass under the radar.
Nevertheless, there are some indications that an exodus of carriers — whether minor or major — is underway. While this developing trend is tragic for those struggling businesses, declining capacity remains the only probable way for carrier rates to rise in the near future (absent a miraculous surge of consumer demand, that is).
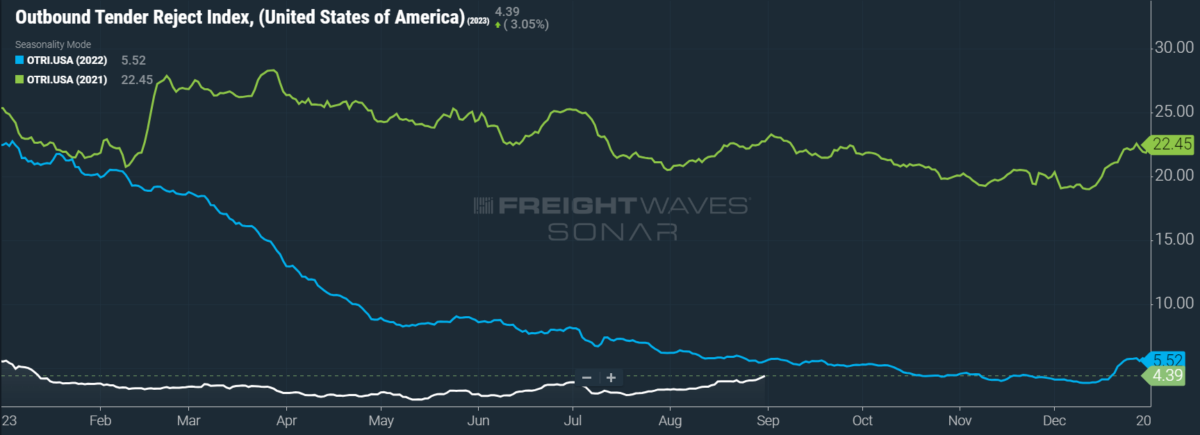
SONAR: OTRI.USA: 2023 (white), 2022 (blue) and 2021 (green)
To learn more about FreightWaves SONAR, click here.
Over the past week, OTRI, which measures relative capacity in the market, rose to 4.39%, a change of 51 basis points (bps) from the week prior. OTRI is now only 114 bps below year-ago levels, with y/y comparisons becoming only more favorable as this rally continues.
According to data from the Bureau of Labor Statistics, truck transportation jobs plummeted in August. A total of 36,700 jobs in the subsector were lost in the month. While it will not be known for certain until next month whether these losses were primarily attributable to truckload or LTL carriers, it is more than likely that the bankruptcy of LTL giant Yellow Corp. was responsible for a large portion of them.
In other signs of weakness from the broader industry, FedEx’s parcel division is set to lay off 280 employees from a facility in Fort Worth, Texas. This announcement marks the latest in a string of FedEx layoffs across the country, with the carrier eliminating more than 900 jobs in 2023 so far. Additionally, Chicago-based freight brokerage Coyote Logistics has laid off an unspecified number of employees this week as part of a larger restructuring effort within the company.
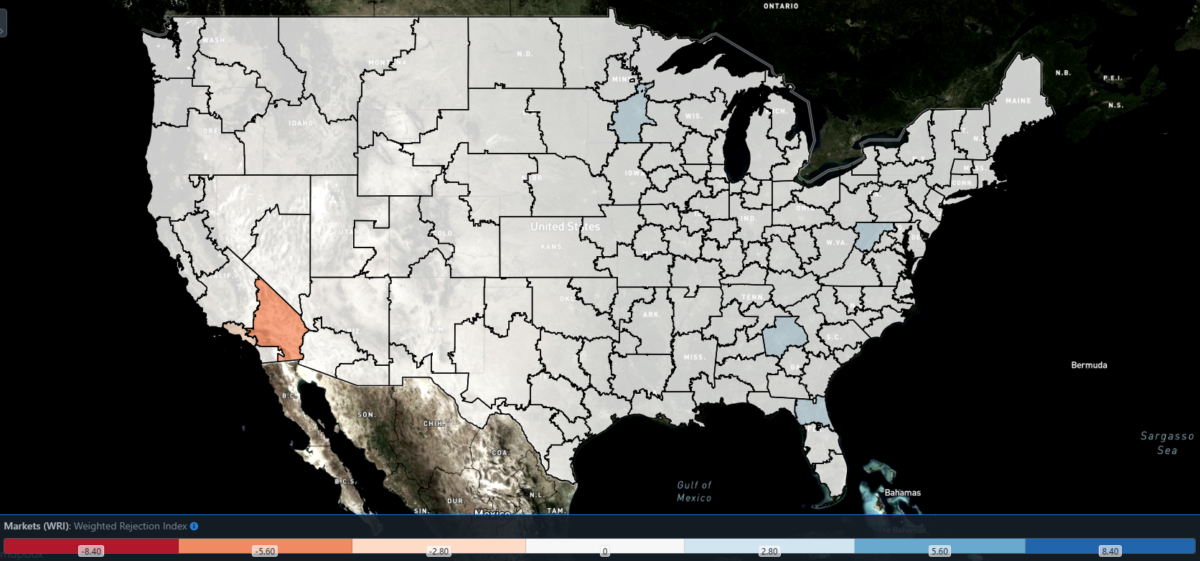
SONAR: WRI (color)
To learn more about FreightWaves SONAR, click here.
The map above shows the Weighted Rejection Index (WRI), the product of the Outbound Tender Reject Index — Weekly Change and Outbound Tender Market Share, as a way to prioritize rejection rate changes. As capacity is generally finding freight this week, only a few regions posted blue markets, which are usually the ones to focus on.
Of the 135 markets, 95 reported higher rejection rates over the past week, though 54 of those saw increases of only 100 or fewer bps.
To learn more about FreightWaves SONAR, click here.
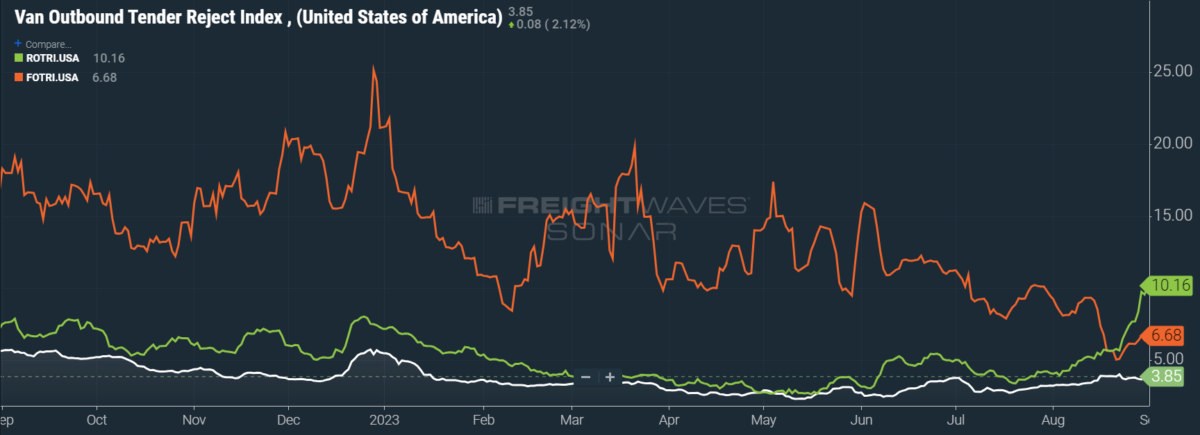
By mode: In an ominous sign of the aforementioned weakness to hit the industrial sector, the Flatbed Outbound Tender Reject Index (FOTRI) has barely recovered from last week’s dip to 5.02% — FOTRI’s lowest reading since June 2020. FOTRI is currently up 81 bps w/w at 6.68%, while the days of double-digit percentage readings seem quite distant.
Reefers, in stark contrast, are posting their highest rejection rates since May of last year. The Reefer Outbound Tender Reject Index (ROTRI) is up a staggering 323 bps w/w at 10.16% and is even up a clean 300 bps y/y. The Van Outbound Tender Reject Index (VOTRI) has not mirrored the unambiguous success of ROTRI but has risen appreciably from mid-May’s cycle low. VOTRI is now up 18 bps w/w at 3.85%.
Deep in the heart of (West) Texas
Prices of West Texas Intermediate crude (WTI) — a domestic benchmark for oil prices — reached their year-to-date high of $85 per barrel on Friday. There are more than a few drivers behind this rally: U.S. inventories of crude oil have been plummeting with alarming rapidity; exports from Saudi Arabia have just hit their lowest level since March 2021; global demand has been spurred by a weakening dollar, which makes oil more affordable for nondollar holders. Of course, as oil prices rise, so also do prices of gasoline and diesel, which could pad margins for carriers able to buy diesel at bulk rates while charging shippers retail prices.
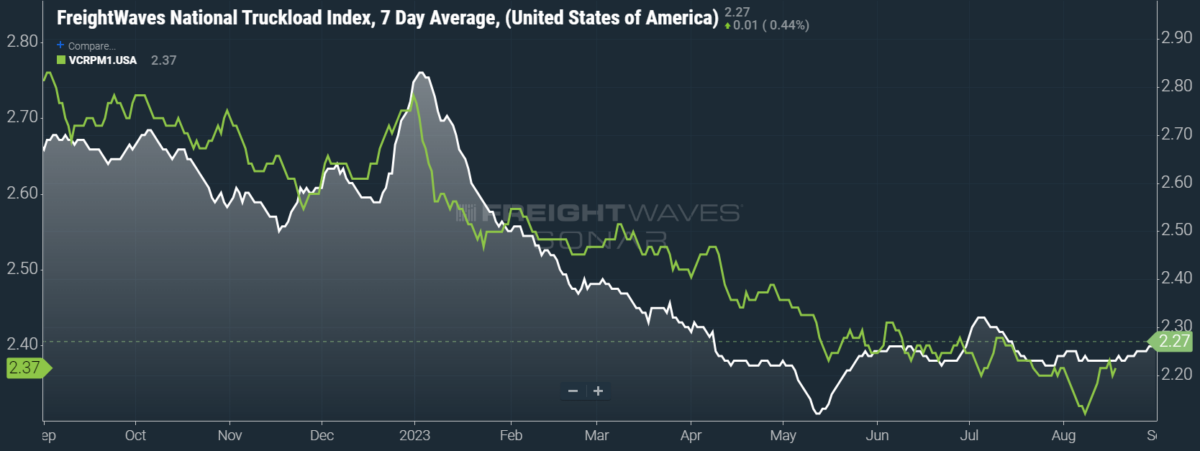
SONAR: National Truckload Index, 7-day average (white; right axis) and dry van contract rate (green; left axis).
To learn more about FreightWaves SONAR, click here.
This week, the National Truckload Index (NTI) — which includes fuel surcharges and other accessorials — rose 3 cents per mile to $2.27. Rising linehaul rates were largely responsible for these gains, as the linehaul variant of the NTI (NTIL) — which excludes fuel surcharges and other accessorials — rose 2 cents per mile w/w to $1.59.
Contract rates, which are reported on a two-week delay, are showing early signs of recovery after an early August dip to their lowest reading since February 2021. Despite a 3-cent-per-mile w/w gain to $2.37, contract rates — which exclude fuel surcharges and other accessorials like the NTIL — are averaging 2.5% lower in Q3 so far than they did in the previous quarter. Any near-term improvement in contract rates is unlikely, to say the least.
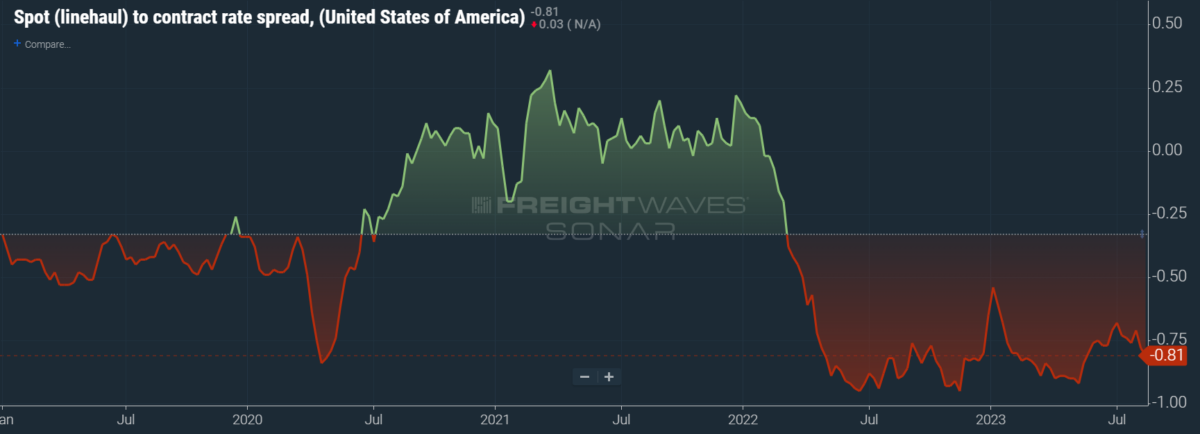
To learn more about FreightWaves SONAR, click here.
The chart above shows the spread between the NTIL and dry van contract rates, revealing the index has fallen to all-time lows in the data set, which dates to early 2019. Throughout that year, contract rates exceeded spot rates, leading to a record number of bankruptcies in the space. Once COVID-19 spread, spot rates reacted quickly, rising to record highs seemingly weekly, while contract rates slowly crept higher throughout 2021.
Despite this spread narrowing significantly early in the year, tightening by 20 cents per mile in January, it has widened again throughout the year to date. As linehaul spot rates remain 81 cents below contract rates, there is still plenty of room for contract rates to decline — or for spot rates to rise — in the remainder of the year.
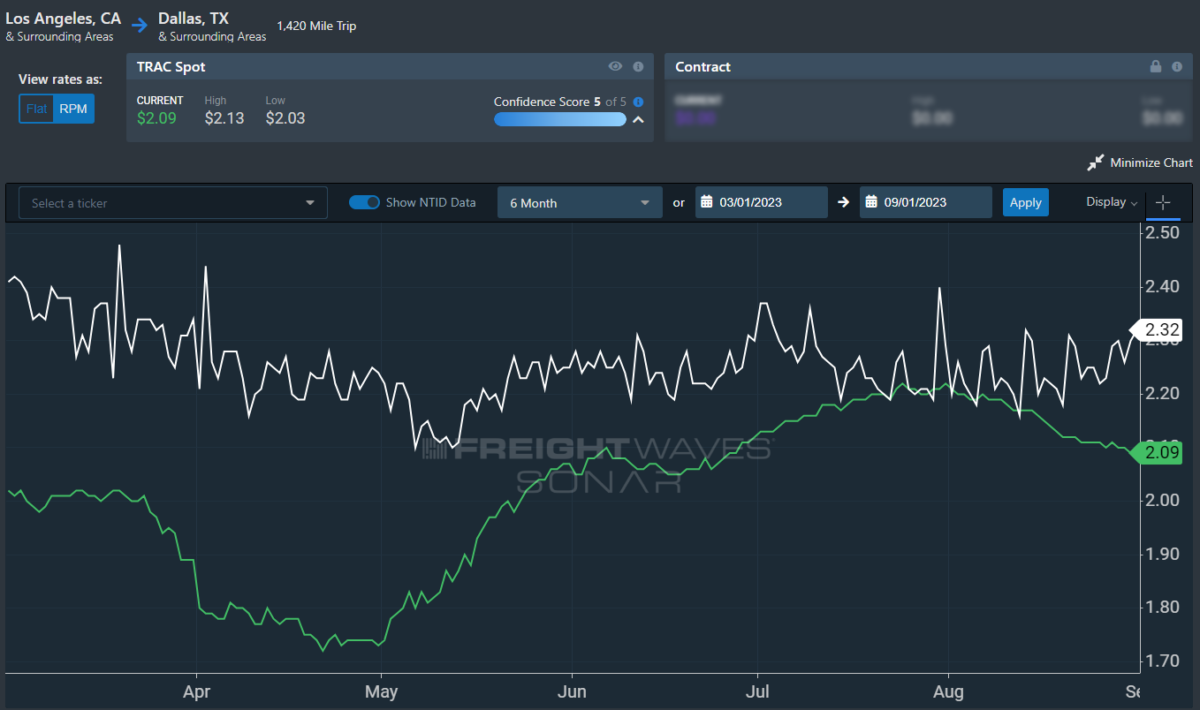
To learn more about FreightWaves TRAC, click here.
The FreightWaves Trusted Rate Assessment Consortium (TRAC) spot rate from Los Angeles to Dallas, arguably one of the densest freight lanes in the country, has seen a slowdown in its prior momentum. Over the past week, the TRAC rate fell 2 cents per mile to $2.09 — still some distance from its year-to-date high of $2.39. The daily NTI (NTID), which has risen to $2.32, is handily outpacing rates along this lane.
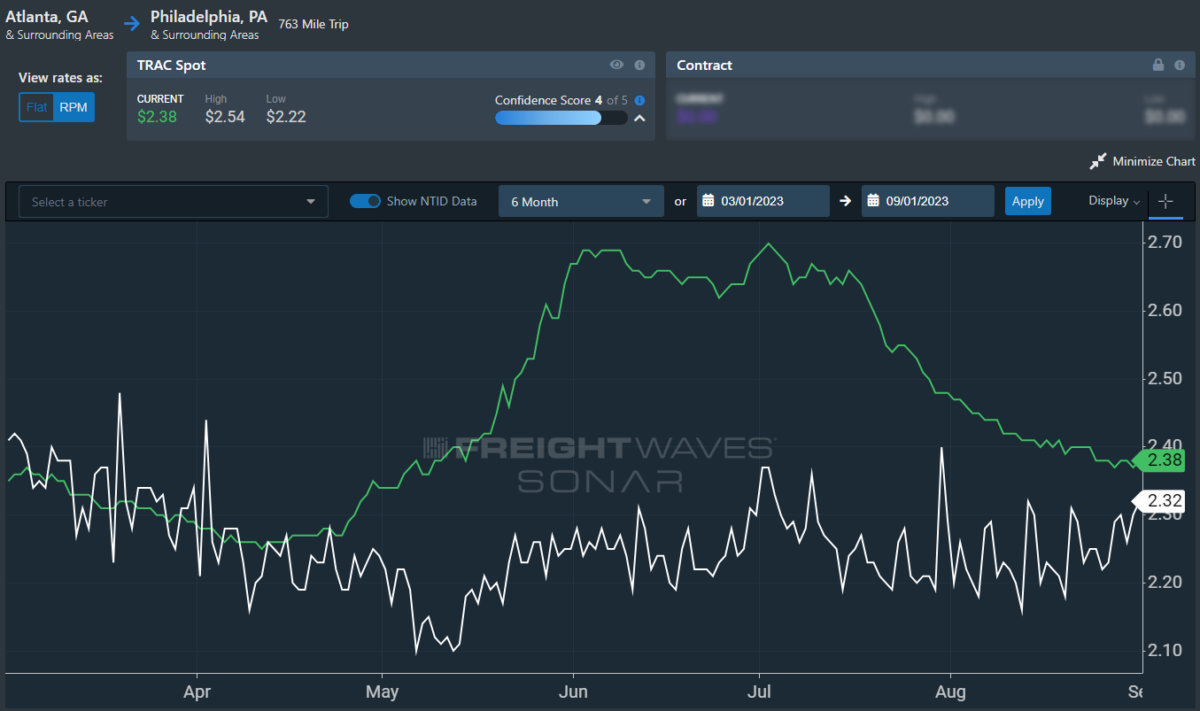
To learn more about FreightWaves TRAC, click here.
On the East Coast, especially out of Atlanta, rates have come down from July’s early peak but are still outpacing the NTID. The FreightWaves TRAC rate from Atlanta to Philadelphia remained unchanged w/w at $2.38. After a bull run that started at the end of April, this lane was plateauing above the national average, which made north-to-south lanes in the East far more attractive than West Coast alternatives.
For more information on FreightWaves’ research, please contact Michael Rudolph at mrudolph@freightwaves.com or Tony Mulvey at tmulvey@freightwaves.com.
The post Back despite popular demand appeared first on FreightWaves.
Source: freightwaves - Back despite popular demand
Editor: Michael Rudolph