Freight News:
Refrigerated truckload demand stays hot in early winter

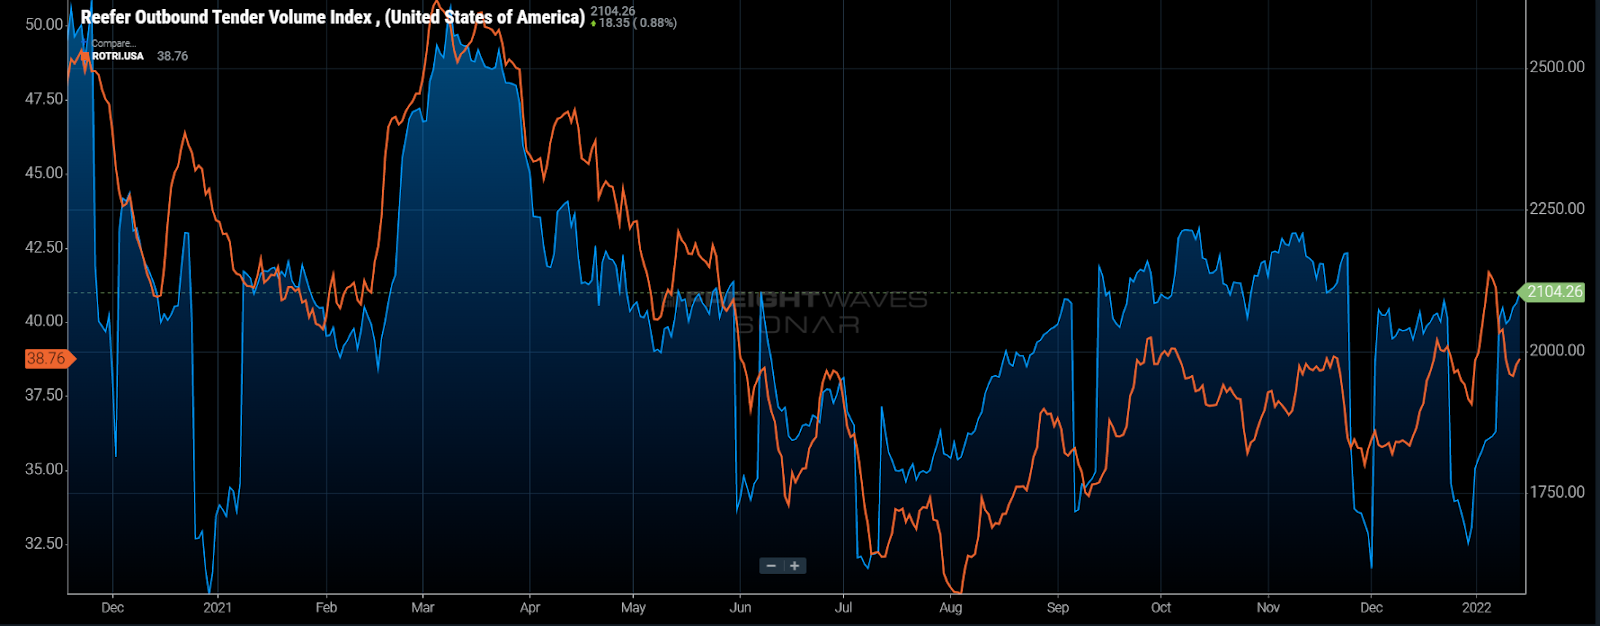
Chart of the Week: Reefer Outbound Tender Volume Index, Reefer Outbound Tender Rejection Index – USA SONAR: ROTVI.USA, ROTRI.USA
Demand for refrigerated or reefer truckload capacity appears to be sustaining and even trending higher into what is traditionally a slower period for the sector, according to the Reefer Outbound Tender Volume Index (ROTVI). The ROTVI is a measure of demand for refrigerated truckload capacity that counts and indexes total electronic requests submitted by shippers to carriers. The percentage of these requests being rejected is represented in the Reefer Outbound Tender Reject Index (ROTRI), which is also showing signs of trending higher this January after breaking over 40% for the first time since May.
Looking at the chart, this is not unprecedented territory for either index as rejection rates and tender volumes were much higher earlier in 2021 after the deep freeze event in Texas sent shippers into an ordering frenzy. Since then the ROTVI has taken a roller-coaster ride, dipping to its annual low point in July before climbing to a fourth-quarter peak in November.
Tender volumes dropped once again in December while capacity tightened and rejection rates increased. While a similar pattern existed at the end of 2020 from November into early January 2021, it is a divergence from pre-pandemic seasonalities. If we have learned anything over the past year, it is the fact we cannot apply pre-pandemic patterns to the current freight environment just yet.
The big difference from last year is the increasing trend in tender rejection rates that starts in December. The ROTRI peaked after the new year, much later than any other holiday season since the beginning of the index in 2018. The ROTRI continues to show resistance to falling back to pre-Christmas levels as well — something that had already occurred at this point in 2021.
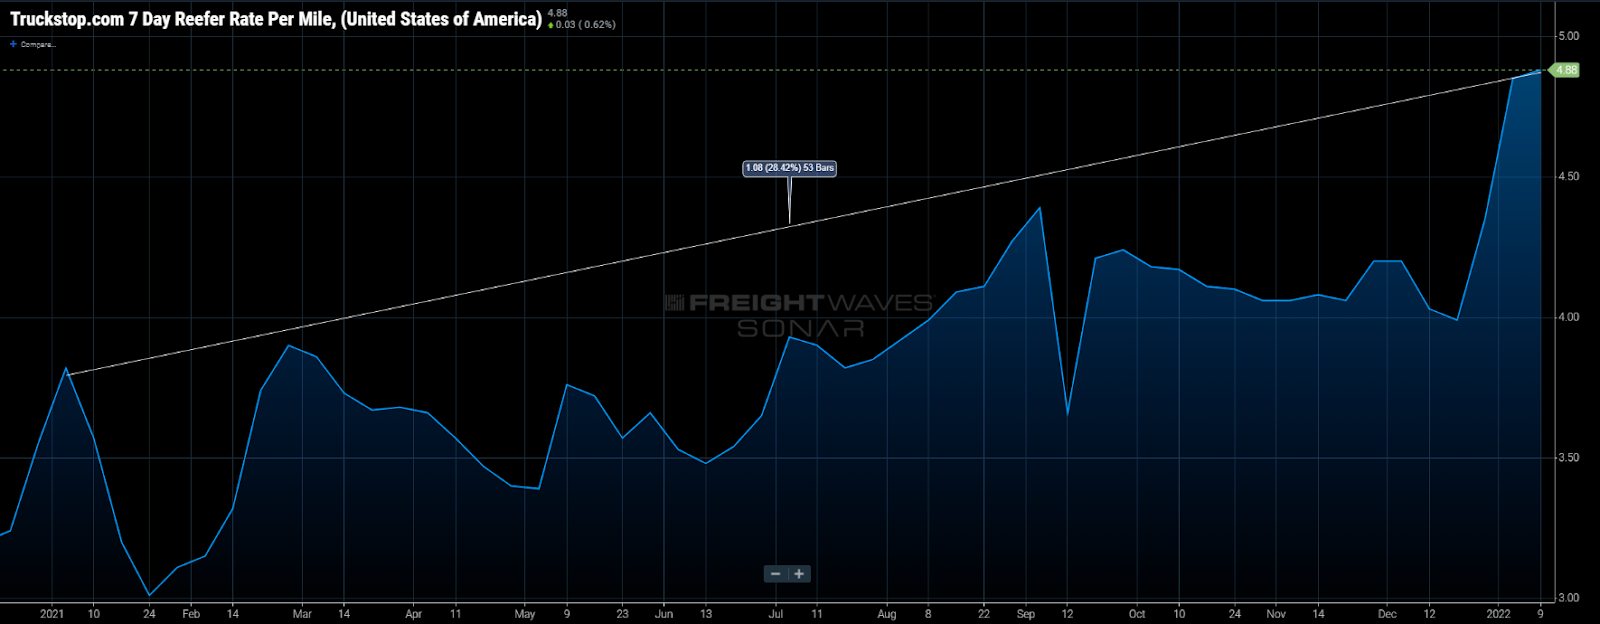
It is important to note that rejection rates are a lot more expensive than they were at this point last year as well. Even though the ROTRI was higher with a rate around 41% on Jan. 14, 2021, there have been significant rate increases over the past year, with spot rates increasing 28% over the same period last year.
With a current value around 38%, these rate increases have not had a strong impact on carrier compliance. The much denser dry van sector has had a similar experience, though at a much more subdued level.
The van and reefer modes are inherently connected as reefer carriers can and do haul dry van freight, so general capacity fluctuations are represented in both modes. Reefer freight tends to be more inconsistent and seasonal with a much lower population of equipment in the U.S. This leads to much stronger spot rate fluctuations that are extremely regionalized.
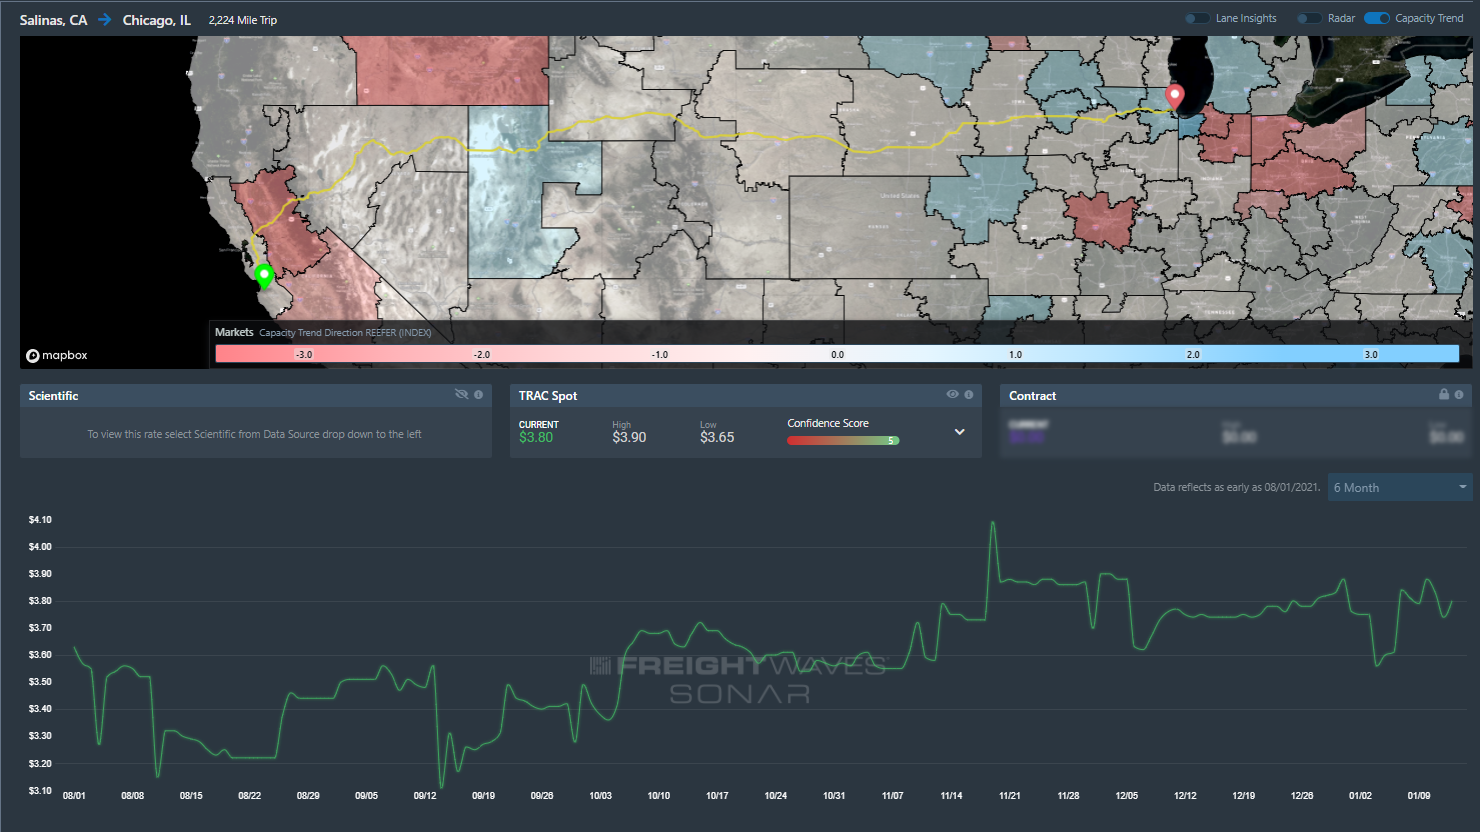
Looking at FreightWaves SONAR Market Dashboard TRAC spot rates for rates from northern California to Chicago, we see a stickiness to the rates through the first two weeks of the year. This is traditionally a slow period of time in this lane, famous for produce moves during spring harvest. We are currently seeing spot rates well beyond the previous spring peak values in 2021.
The big takeaway from this, as was the case in last week’s chart, is that seasonality is effectively broken, even for a sector that is driven by seasonal movement.
About the Chart of the Week
The FreightWaves Chart of the Week is a chart selection from SONAR that provides an interesting data point to describe the state of the freight markets. A chart is chosen from thousands of potential charts on SONAR to help participants visualize the freight market in real time. Each week a Market Expert will post a chart, along with commentary, live on the front page. After that, the Chart of the Week will be archived on FreightWaves.com for future reference.
SONAR aggregates data from hundreds of sources, presenting the data in charts and maps and providing commentary on what freight market experts want to know about the industry in real time.
The FreightWaves data science and product teams are releasing new data sets each week and enhancing the client experience.
To request a SONAR demo, click here.
Source: https://www.freightwaves.com/news
Editor: Zach Strickland, FW Market Expert & Market Analyst