Freight News:
Weakness in freight shipments to linger, Cass says
Shipment data captured by payment services provider Cass Information Systems was only off modestly in February while freight costs plummeted on a tough comp.
The Cass Freight Index registered a 0.3% year-over-year (y/y) decline in shipments while the expenditures component of the data set, which measures the total costs associated with shipping freight, fell 9.7% y/y. The costs index was up against a tough comp (up 42.2% y/y in February 2022).
Shipments were up 3.8% from January after five months of declines. On a seasonally adjusted basis, the index was down just 0.3% sequentially, “extending a streak of remarkable stability from October through February,” ACT Research’s Tim Denoyer said.
“Soft real retail sales trends and ongoing destocking remain the primary headwinds to freight volumes, and sharp import declines suggest this type of environment will persist for several more months,” Denoyer added.
| February 2023 | y/y | 2-year | m/m | m/m (SA) |
| Shipments | -0.3% | 3.3% | 3.8% | -0.3% |
| Expenditures | -9.7% | 28.4% | -1.9% | -3.9% |
| TL Linehaul Index | -6.0% | 5.9% | -0.4% | NM |
During the fourth-quarter earnings season, which concluded in February, management teams from most carriers signaled an expectation that freight demand would improve by the back half of the year. While the trucking industry is still potentially months away from a positive inflection, as shippers continue to purge inventories, less-than-truckload carrier Old Dominion Freight Line (NASDAQ: ODFL) recently said it appears that shipments are stabilizing.
The commentary from Old Dominion was contrary to the actual numbers reported by some LTL carriers in January and February, which showed y/y tonnage declines accelerating. However, the comps were to February 2022, which marked the ending of the cycle’s peak.
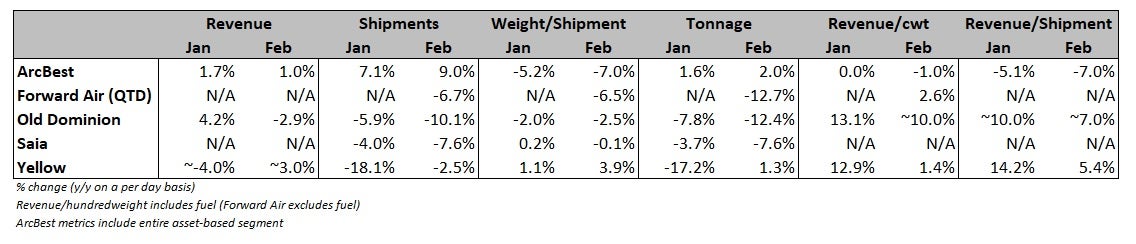
Denoyer noted that “there has been a considerable increase in the proportion of truckload freight over the past several months, amid declines in less-than-truckload and intermodal volumes.”
Compared to two years ago, the Cass shipments subindex was 3.3% higher during February.
Even with Cass’ expenditures data set down nearly 10% y/y, the subindex was still nearly 30% higher on a two-year stacked comp. Total freight costs in February were down 3.9% seasonally adjusted from January.
With shipments up 3.8% sequentially and expenditures down 1.9% (both seasonally unadjusted) the implication is that actual freight rates were off 5.5% in February. Lower fuel costs and the change in mix weighed on total freight bills, according to the report.
Inferred rates were down 9.4% y/y. Similar y/y declines are expected in the coming months, the report said.
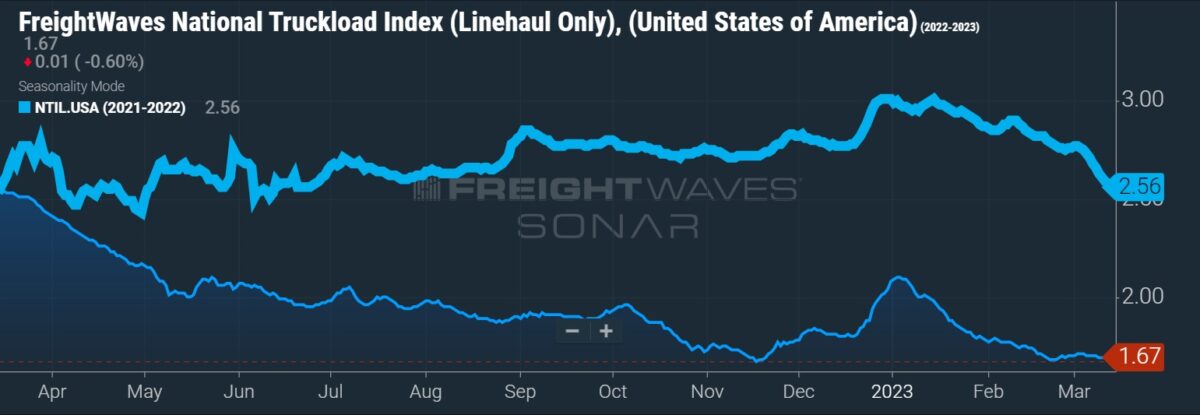
Cass’ Truckload Linehaul Index, which includes spot and contract freight, fell 6% y/y in February, a second straight month of mid-single-digit declines. The back-to-back drops follow 26 consecutive months of increases for the index.
The linehaul index was still 5.9% higher than two years ago, but the window appears to be closing.
“With spot rates already down significantly, the larger contract market is likely to continue adjusting down, if more gradually, but in the same direction,” Denoyer said.
“At the risk of stating the obvious, the fundamental reason truckload spot rates are still falling is there are too many drivers chasing too little freight,” Denoyer continued. “But the freight market is constantly dynamic, and we expect current loose conditions to first rebalance and then tighten over the course of the next year or so.”
A contraction in the driver pool and an increase in failures of spot market-dependent carriers were cited as catalysts.
Data used in the Cass indexes is derived from freight bills paid by Cass (NASDAQ: CASS), a provider of payment management solutions. Cass processes $44 billion in freight payables annually on behalf of customers.
More FreightWaves articles by Todd Maiden
- Yellow’s yield-at-all-cost strategy may be ending
- XPO adds former Old Dominion CFO to board
- Forward Air’s tonnage declines ahead of peers; March numbers improve
Dry van freight volumes decline, pushing rejection rates down to 3.35%
videojs.getPlayer('1760350945680480669').ready(function() {
var myPlayer = this;
myPlayer.on("loadedmetadata", function() {
var browser_language, track_language, audioTracks;
browser_language = navigator.language || navigator.userLanguage; // IE <= 10
browser_language = browser_language.substr(0, 2);
audioTracks = myPlayer.audioTracks();
for (var i = 0; i < audioTracks.length; i++) {
track_language = audioTracks[i].language.substr(0, 2);
if (track_language) {
if (track_language === browser_language) {
audioTracks[i].enabled = true;
}
}
}
});
});
The post Weakness in freight shipments to linger, Cass says appeared first on FreightWaves.
Source: freightwaves - Weakness in freight shipments to linger, Cass says
Editor: Todd Maiden