Freight News:
Truckload capacity flips from unsustainably tight to unsustainably loose

Chart of the Week: National Outbound Tender Reject Index – USA SONAR: OTRI.USA
For the first time since the economy was shuttered in the early phases of the COVID-19 pandemic, the national Outbound Tender Reject Index (OTRI) has fallen below 3%, making early 2023 the softest sustained truckload market since the tender data history began in early 2018.
Tender rejection rates measure how willing carriers are to accept requests from the customers to ship loads at a previously agreed upon contract rate. Rejection rates above 6-7% typically indicate a tighter market in which spot market rates and volumes increase. When rejection rates are below 5%, the inverse occurs.
Tender rejection rates show how willing and able carriers are to service their customers at contracted rate levels. When they have better paying opportunities and limited availability, they have to prioritize more profitable loads. Basically, they measure how strained carrier networks are. Right now, there is a lot of slack.
During 2021, the OTRI averaged almost 23%, and both spot and contract rates increased rapidly throughout the year. Record consumer demand overwhelmed supply chains and subsequently transportation networks did not have sufficient capacity to handle the load.
2019 and early 2020 were relatively soft periods for trucking, when capacity was abundant but eroding from the market. The OTRI averaged 6% in 2019, while spot rates were relatively flat but moved in response to seasonal pressures.
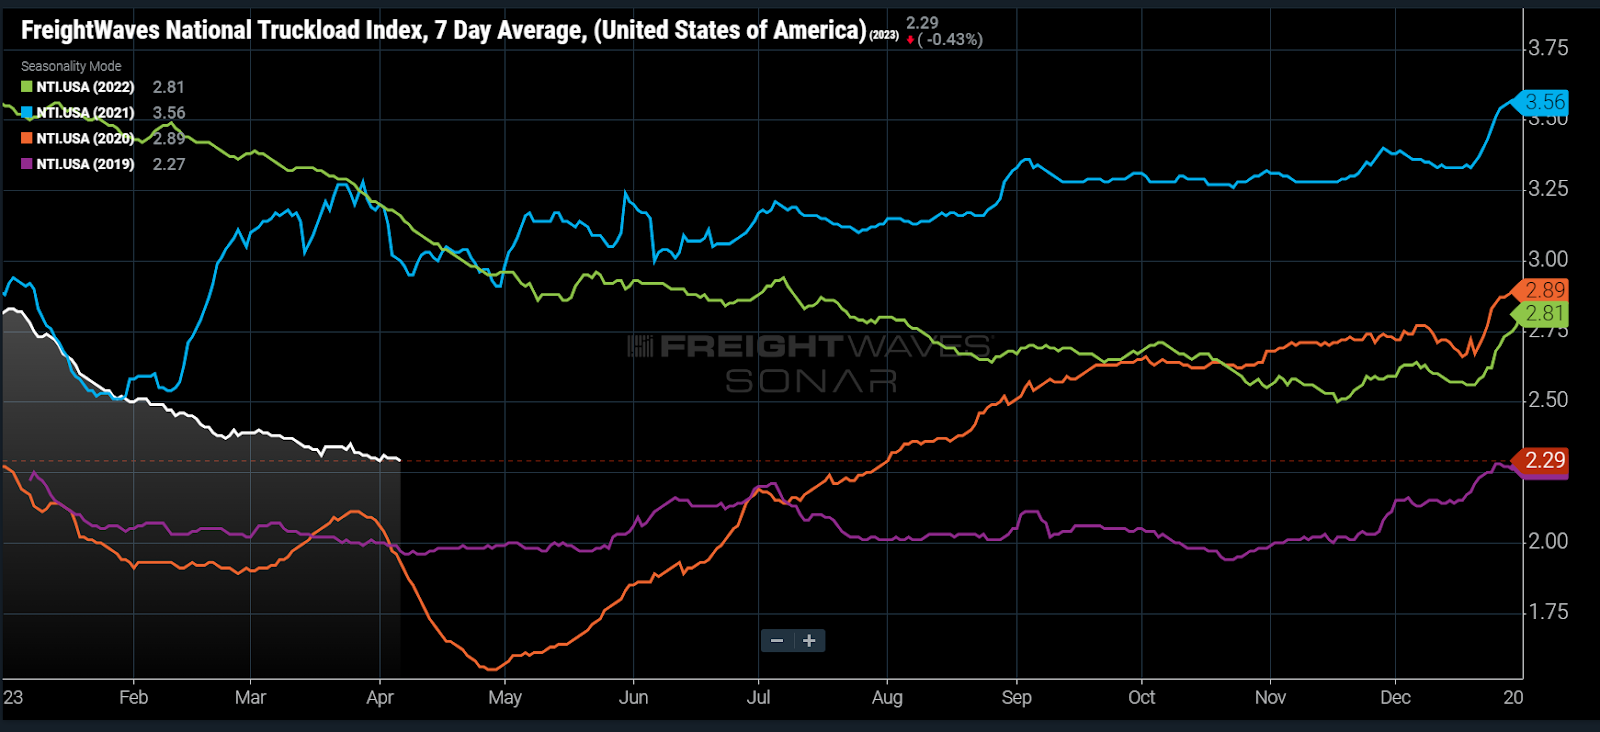
The National Truckload Index (NTI), which measures the average spot rate for dry van loads from FreightWaves Trusted Rate Assessment Consortium (TRAC), shows that rates are still falling entering April at a much stronger downward trajectory than what many would call a more normal year. Excluding the total estimated cost of fuel, rates are only 7% higher than April 2019.
There is a case to be made for the spot market hitting a bottom in terms of rates over the next month. But that depends on how disciplined carriers are with their pricing.
Larger, contract-heavy fleets have not been feeling market pressures as long or as strong as the smaller, spot-market-dependent fleets have. That is evidenced by looking at accepted tender volumes and contract rates.

The Contract Load Accepted Volume Index (CLAV) measures load volumes that were accepted and moved under contract rates. As of this week, accepted volumes are still 8% higher than they were prior to the pandemic, but that is not the full story.
Contract rates for van loads (VCRPM1) are still averaging 24% above where they were in April 2019, a much stronger rate situation than the spot market. This is also a driving force behind rejection rates being close to all-time lows for so long.
What this means is that there are essentially no loads falling from the contract to the spot market, something that characterized the 2020 to early ’22 era. Many carriers became accustomed to this volume of transactional business and built their networks around something that has completely evaporated in a relatively short period of time.
Like the 23% rejection rate, sub-3% rejection rates are not sustainable even if demand remains consistent. Rejection rates below 4% are indicative of carriers having too many gaps in their networks to maintain utilization levels and cover their costs effectively.
High levels of competition keep margins low for lanes where profitability is possible, which means that exits are inevitable. The OTRI will become increasingly sensitive to seasonal events as capacity falls more in line with demand. 2019 was a good example of this, with rejection rates pulsing higher as the cycle moved forward. The same will inevitably occur this year, but the speed is still in question.
About the Chart of the Week
The FreightWaves Chart of the Week is a chart selection from SONAR that provides an interesting data point to describe the state of the freight markets. A chart is chosen from thousands of potential charts on SONAR to help participants visualize the freight market in real time. Each week a Market Expert will post a chart, along with commentary, live on the front page. After that, the Chart of the Week will be archived on FreightWaves.com for future reference.
SONAR aggregates data from hundreds of sources, presenting the data in charts and maps and providing commentary on what freight market experts want to know about the industry in real time.
The FreightWaves data science and product teams are releasing new datasets each week and enhancing the client experience.
To request a SONAR demo, click here.
The post Truckload capacity flips from unsustainably tight to unsustainably loose appeared first on FreightWaves.
Source: freightwaves - Truckload capacity flips from unsustainably tight to unsustainably loose
Editor: Zach Strickland, FW Market Expert & Market Analyst