Freight News:
Markets are bad, but they could be worse
This week’s FreightWaves Supply Chain Pricing Power Index: 30 (Shippers)
Last week’s FreightWaves Supply Chain Pricing Power Index: 35 (Shippers)
Three-month FreightWaves Supply Chain Pricing Power Index Outlook: 20 (Shippers)
The FreightWaves Supply Chain Pricing Power Index uses the analytics and data in FreightWaves SONAR to analyze the market and estimate the negotiating power for rates between shippers and carriers.
This week’s Pricing Power Index is based on the following indicators:
Volumes torn between easy and punishing comps
Volumes are looking impressive on a weekly basis, helped by favorable comps over a slight depression during last week’s federal holiday. Yearly comparisons are equally unhelpful, though for the opposite reason: In 2022, shippers were unusually active throughout the first quarter, which is traditionally known as the “quiet season” in freight. The flurry of activity made perfect sense for the time, given that truckload markets in 2021 held little but frustration and disappointment for shippers.
Now, however, it is all but certain shippers will fail to exceed or even meet last year’s breakneck growth, constrained as they are by weakened consumer demand and towering inventories. Yet volumes are outpacing the levels of 2019 and ’20 so far, suggesting the market’s current weakness stems from an overabundance of capacity rather than cratering demand.
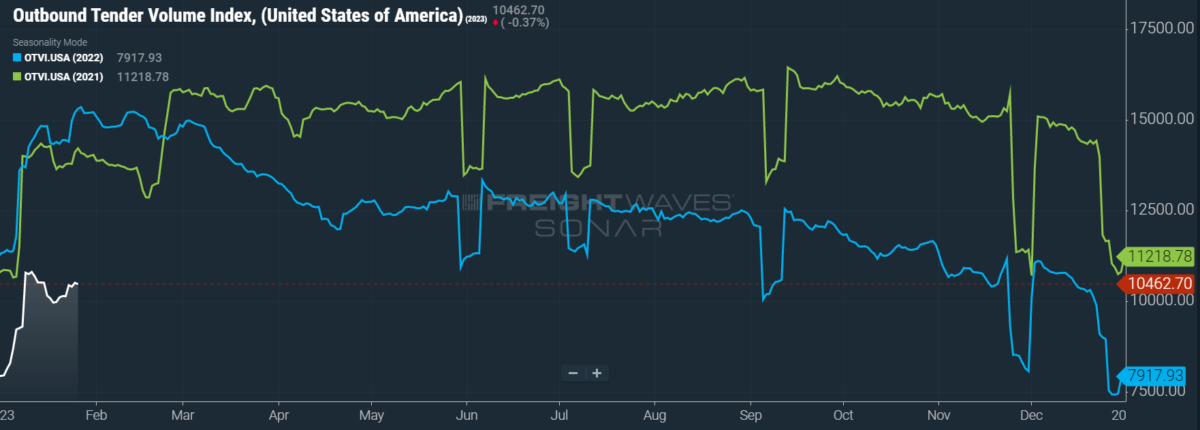
SONAR: OTVI.USA: 2023 (white), 2022 (blue) and 2021 (green)
To learn more about FreightWaves SONAR, click here.
To reiterate, movements of the Outbound Tender Volume Index (OTVI) on a week-over-week (w/w) basis will not be terribly informative right now, since some shipping and receiving facilities were observing Martin Luther King Jr. Day on Jan. 16. Nevertheless, OTVI did rise 4.91% w/w. On a year-over-year (y/y) basis, OTVI is down 31.84%, though such y/y comparisons can be colored by significant shifts in tender rejections. OTVI, which includes both accepted and rejected tenders, can be artificially inflated by an uptick in the Outbound Tender Reject Index (OTRI).
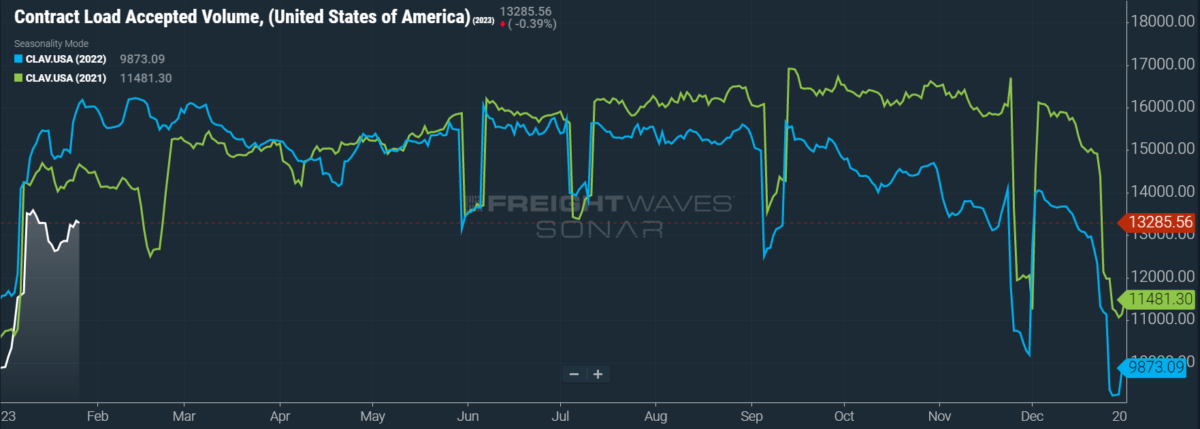
SONAR: CLAV.USA: 2023 (white), 2022 (blue) and 2021 (green)
To learn more about FreightWaves SONAR, click here.
Contract Load Accepted Volumes (CLAV) is an index that measures accepted load volumes moving under contracted agreements. In short, it is similar to OTVI but without the rejected tenders. Looking at accepted tender volumes, we see a rise of 5% w/w as well as a fall of 17.5% y/y. While this y/y difference does confirm actual cracks in freight demand — and not merely OTRI’s y/y decline — are driving OTVI lower, it is worth restating that the first quarter of 2022 was an unusually active season for shippers, which thus makes for difficult comps. At the start of ’22, shippers were beginning to account for the unforeseen volatility of truckload markets and were eager to secure capacity during the traditionally quiet season of Q1.
The Bureau of Economic Analysis released its advance estimate on gross domestic product (GDP) growth for Q4 2022. While the headline number is impressive, rising 2.9% y/y against consensus expectations of 2.6% growth, the finer details do not inspire much confidence for truckload markets specifically. For one, a key driver of this growth was consumer spending on services, which rose 2.6% y/y. As we all know, services — especially those that saw the greatest gains, like health care, housing and utilities — are relatively immaterial to freight demand. Service exports, such as those related to travel, finance and market research, saw monstrous growth of 12.4% y/y.
Another key driver of headline GDP growth was businesses’ continued accumulation of inventories, particularly in the manufacturing, mining and construction sectors. As longtime readers of this column know well, manufacturers were the final segment of the economy that had yet to experience the same inventory glut that has affected retailers and their upstream suppliers. On the flip side, investments into residential housing fell 26.7% y/y, compounding Q3’s decline of 27.1% y/y.
For freight markets, the most important surrogate for future consumer demand is arguably real final sales to private domestic purchasers, which excludes net exports, inventories and government spending. In Q4 2022, these sales rose only 0.2% on an annual basis, down from 1.1% in Q3 and the slowest pace of growth seen since the COVID-affected Q2 2020. Adding fuel to this fire was December’s data on durable goods, a significant driver of truckload volumes. After excluding defense spending and aircraft orders, expenditure on durable goods was down 0.2% from November and up only 3.33% y/y, well outpaced by inflation.
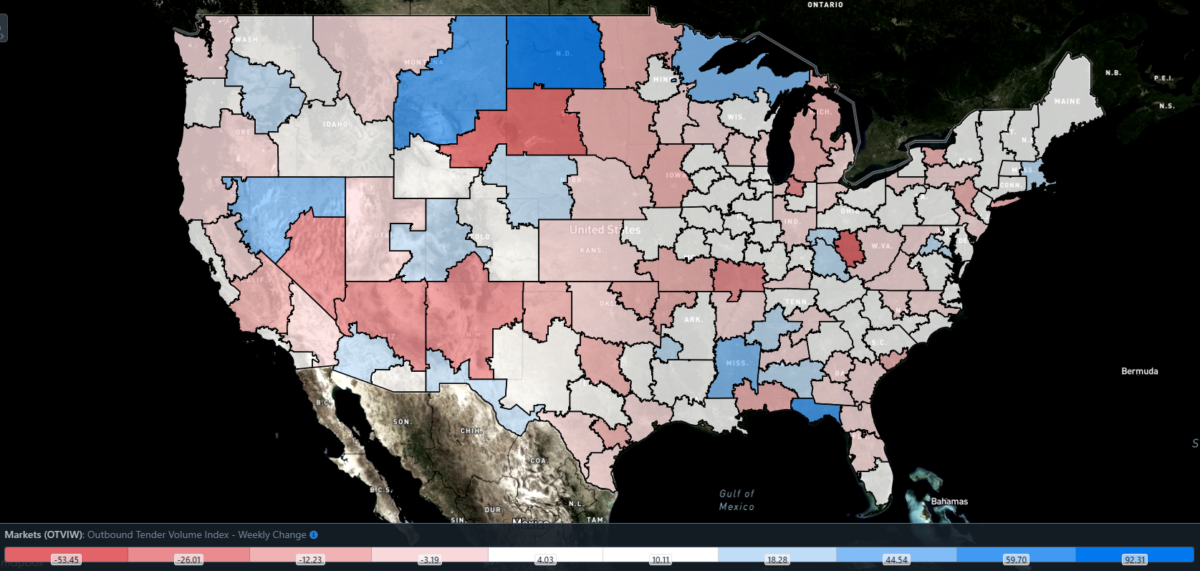
SONAR: Outbound Tender Volume Index – Weekly Change (OTVIW).
To learn more about FreightWaves SONAR, click here.
Of the 135 total markets, 96 reported weekly increases in tender volume as truckload markets breezily outpaced a holiday-affected week.
Since most markets faced easy comps this week, it is worth looking at those in which the local OTVI underperformed against the national index. The port city of Houston, the fourth-largest market by outbound volume, saw volumes rise only 3.02% w/w. The market of Ontario, California, which benefits from import volumes coming into the nearby Ports of Los Angeles and Long Beach, similarly saw freight demand rise only 3.3% w/w. Both markets will likely suffer from a dearth of ocean bookings out of China before it began its 15-day Lunar New Year celebrations, signaling weakened stateside demand.
By mode: Van volumes are the key driver behind the national OTVI’s rebound from last week’s lull, since the Van Outbound Tender Volume Index (VOTVI) is up 4.96% w/w. While VOTVI remains below year-ago levels by 32%, much of this difference can be attributed to the gap in van rejection rates between last year and the present day. Accepted van volumes are nevertheless down 18.4% y/y.
Reefer volumes are nearly the mirror opposite, since the Reefer Outbound Tender Volume Index (ROTVI) is only up 3.6% w/w. ROTVI is also down 32% y/y, but the gap between reefer’s rejection rates from last year and now is much wider than that of van’s. Accepted reefer volumes are actually up 2% y/y, driven by continued gains in the Pacific Northwest.
Tender rejections hit new low
After shedding its holiday gains with unprecedented haste, OTRI has tumbled to its lowest level in the dataset — excluding the pandemic-induced lows of early 2020, which stretched OTRI beyond the bounds of its usual peaks and valleys. In 2019, the year of the industry’s last recession, OTRI hit a yearly low of 3.78%. Before this week, that figure was properly considered to be OTRI’s floor. On Wednesday, however, OTRI hit a new low of 3.76%.
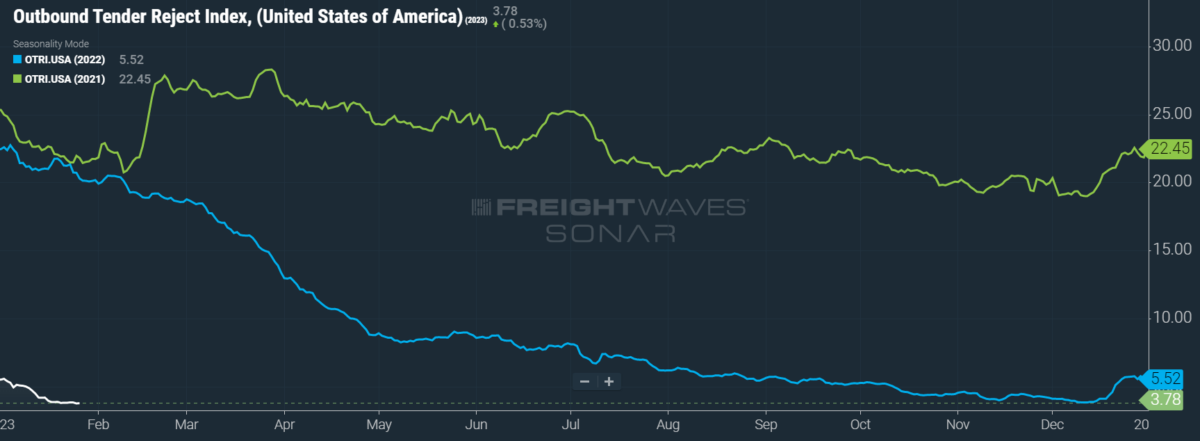
SONAR: OTRI.USA: 2023 (white), 2022 (blue) and 2021 (green)
To learn more about FreightWaves SONAR, click here.
Over the past week, OTRI, which measures relative capacity in the market, fell to 3.78%, a change of 10 basis points (bps) from the week prior. OTRI is now 1,652 bps below year-ago levels.
A number of trucking-related bankruptcies and layoffs have popped up in the news. Uber Freight announced it is laying off roughly 150 employees, or 3% of its total workforce, from its brokerage division. These layoffs will not, however, impact any of the employees in the legacy Transplace division, which Uber Freight acquired in late 2021. Art Mulder & Sons Trucking, a Michigan asset-based LTL carrier that specialized in reefer, is liquidating its assets. At a semiconductor plant in Austin, Texas, Ryder System Inc. is laying off over 800 employees, partially in response to the plant’s shift to insourcing logistics.
Despite these pieces of news, carriers are growing more optimistic about their future prospects than they were last quarter. According to a recent survey conducted by FreightWaves, carrier sentiment increased from Q4 2022 to Q1 2023, unlike their shipper and broker counterparts. Although carriers’ sentiment index on near-term profitability declined from minus-2.83 to minus-8.63, their outlook on long-term profitability jumped from 4.43 to 11.46 — these indices are ranked on a scale from minus-100 to 100, with a positive value indicated expansion and a negative one pointing to contraction.
One cause for celebration is a new piece of bipartisan legislation introduced in the House of Representatives that would award tax credits to drivers and funding for truck parking. The bill, cutely named the Safer Highways and Increased Performance for Interstate Trucking (SHIP IT) Act, would award CDL-holding drivers up to $7,500 in tax relief and give up to $10,000 for new entrants to the industry. $755 million, to be disbursed over the next four years, is also set aside for both the construction of new and expansion of preexisting truck parking lots. While many shipping groups have voiced their support of the bill, the Owner-Operator Independent Drivers Association reserved a few critiques for the bill’s failure to address a handful of issues behind driver retention, including long wait times at shipping facilities.
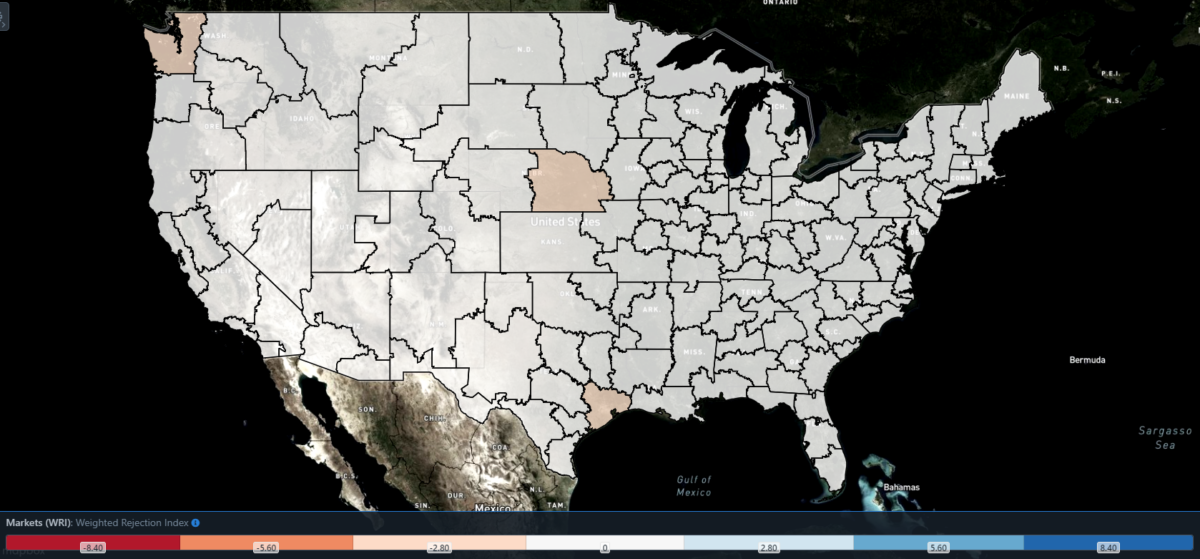
SONAR: WRI (color)
To learn more about FreightWaves SONAR, click here.
The map above shows the Weighted Rejection Index (WRI), the product of the Outbound Tender Reject Index — Weekly Change and Outbound Tender Market Share, as a way to prioritize rejection rate changes. As capacity is generally finding freight this week, no regions posted blue markets, which are usually the ones to focus on.
Of the 135 markets, 69 reported higher rejection rates over the past week, though 46 of those reported increases of only 100 or fewer bps.
In terms of rejection rates, the Seattle market has been on a roller coaster thus far in 2023. After entering the year with a local OTRI above 10%, rejection rates quickly plummeted below 1.3%. Then, in the following week, Seattle’s OTRI climbed to 6% before falling 489 bps w/w to 1.09%, where it sits currently. Washington is still shipping produce like apples, onions, potatoes and pears, adding to the region’s volumes.
To learn more about FreightWaves SONAR, click here.
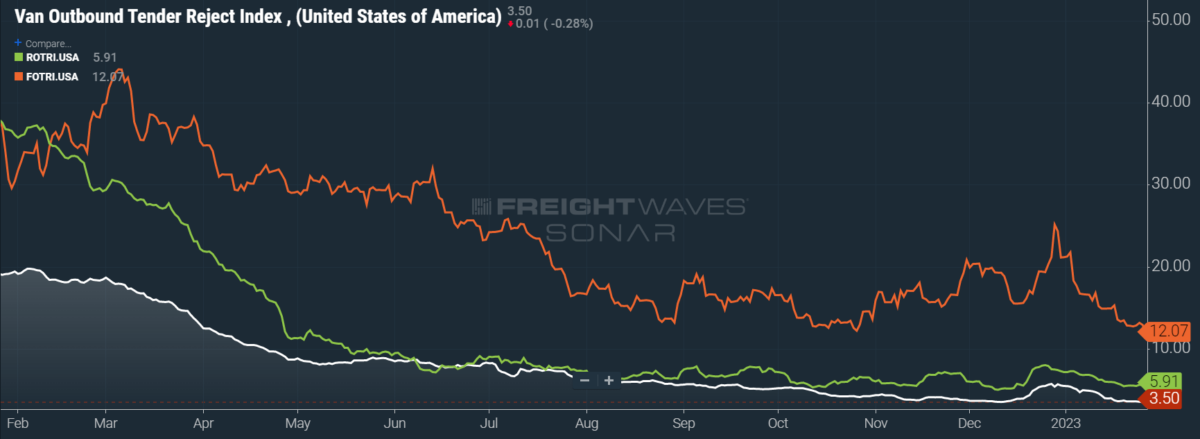
By mode: Flatbed rejection rates have been falling stepwise since the beginning of the year, when the Flatbed Outbound Tender Reject Index (FOTRI) was above 20%. With the aforementioned report that the manufacturing and construction sectors have essentially rebuilt their inventories amid weakened demand, the near future for flatbed markets is none too favorable. For the time being, FOTRI is down 141 bps w/w at 12.07%.
Van rejections are in a similarly bad way, though they are much nearer to their floor than any other mode. In August 2019, the Van Outbound Tender Reject Index (VOTRI) bottomed out at 3.29% — again, excepting pandemic-induced lows. This week, VOTRI fell 21 bps w/w to 3.5%. The Reefer Outbound Tender Reject Index (ROTRI) was the only mode to see gains this week, with ROTRI rising 46 bps w/w to 5.91%. Unlike VOTRI, reefer rejections are currently much lower than they ever were in 2019, when ROTRI reached a yearly low of 8.61%.
Carrier rates suffer from holiday hangover
In addition to a record-low OTRI, the dramatic decline in carrier rates was the largest factor behind this week’s PPI falling to 30. While it was widely expected that carrier rates would be unable to retain their holiday gains, contract rates quickly fell to 2022’s low — a level that not only undid all of the prior year’s increases but also set the clock back to Q3 2021. Spot rates, meanwhile, traveled back in time even further, reaching lows not seen since February 2021. If the spread between contract and spot rates continues to narrow throughout February, the PPI will almost certainly fall to 25 or even 20.
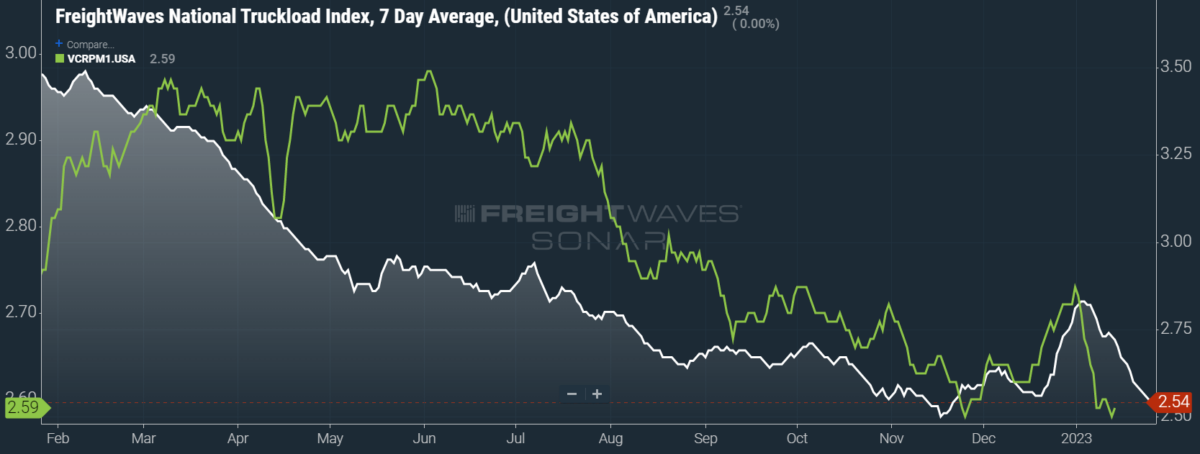
SONAR: National Truckload Index, 7-day average (white; right axis) and dry van contract rate (green; left axis).
To learn more about FreightWaves SONAR, click here.
This week, the National Truckload Index (NTI), which includes fuel surcharges and other accessorials, fell 6 cents per mile w/w to $2.54. The fluctuation of diesel prices remains a nonfactor on the NTI’s movement. The linehaul variant of the NTI (NTIL) — which excludes fuel surcharges and other accessorials — similarly fell 6 cents per mile w/w to $1.82.
Contract rates, which exclude fuel surcharges and other accessorials like the NTIL, fell 4 cents per mile w/w to $2.59. Since contract rates are reported on a two-week delay, current data shows 2023’s headwinds up to mid-January. In most quarters, contract rates do not see their fullest impact until the end of the first month, meaning these rates could still reverse their current losses over the next two weeks. But given the numerous sources of downward pressure on contract rates, I continue to believe such a reversal is highly improbable.
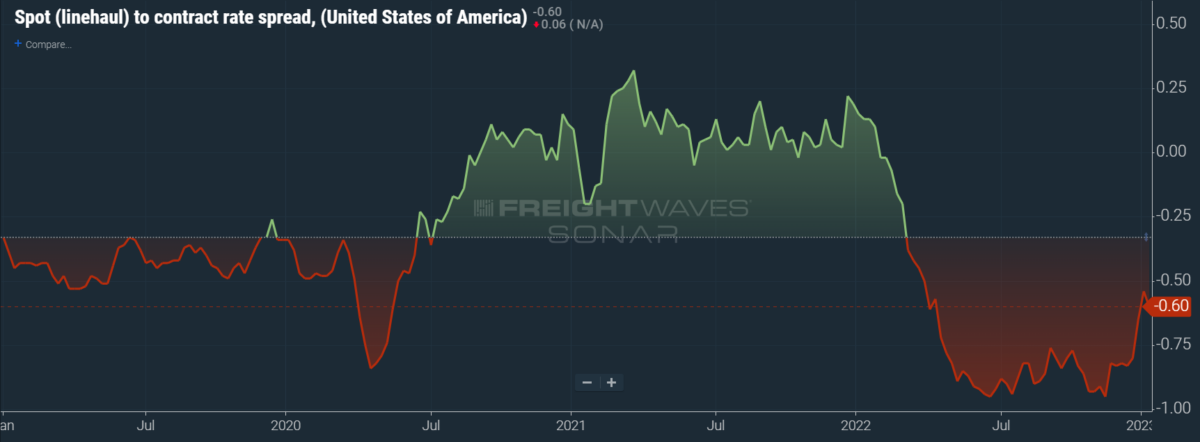
To learn more about FreightWaves SONAR, click here.
The chart above shows the spread between the NTIL and dry van contract rates, revealing the index has fallen to all-time lows in the data set, which dates to early 2019. Throughout that year, contract rates exceeded spot rates, leading to a record number of bankruptcies in the space. Once COVID-19 spread, spot rates reacted quickly, rising to record highs on a seemingly weekly basis, while contract rates slowly crept higher throughout 2021.
This spread has narrowed significantly over the past few weeks, tightening by 20 cents per mile since mid-December. But since the linehaul spot rate remains 60 cents below contract rates, there is still runway for contract rates to decline during the coming months.
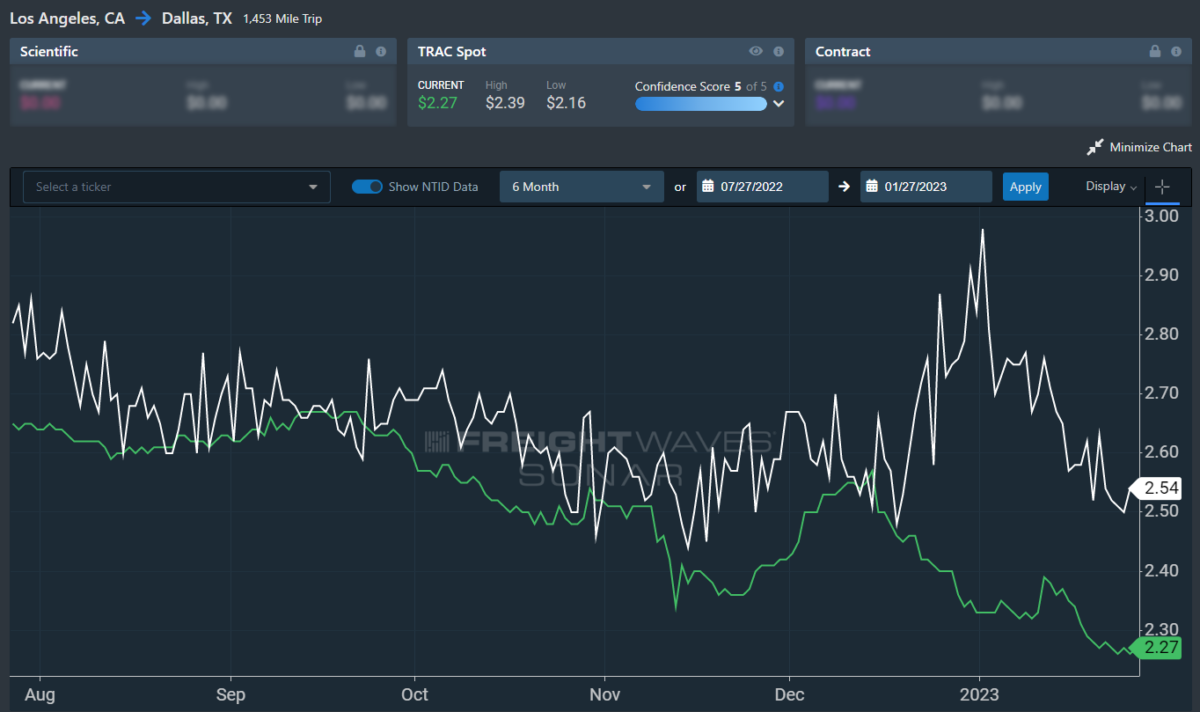
To learn more about FreightWaves TRAC, click here.
The FreightWaves TRAC spot rate from Los Angeles to Dallas, arguably one of the densest freight lanes in the country, is slowly reaching new lows in the data set. Over the past week, the TRAC rate fell 1 cent per mile to $2.27. The daily NTI (NTID), which has fallen to $2.54, continues to outpace rates from Los Angeles to Dallas.
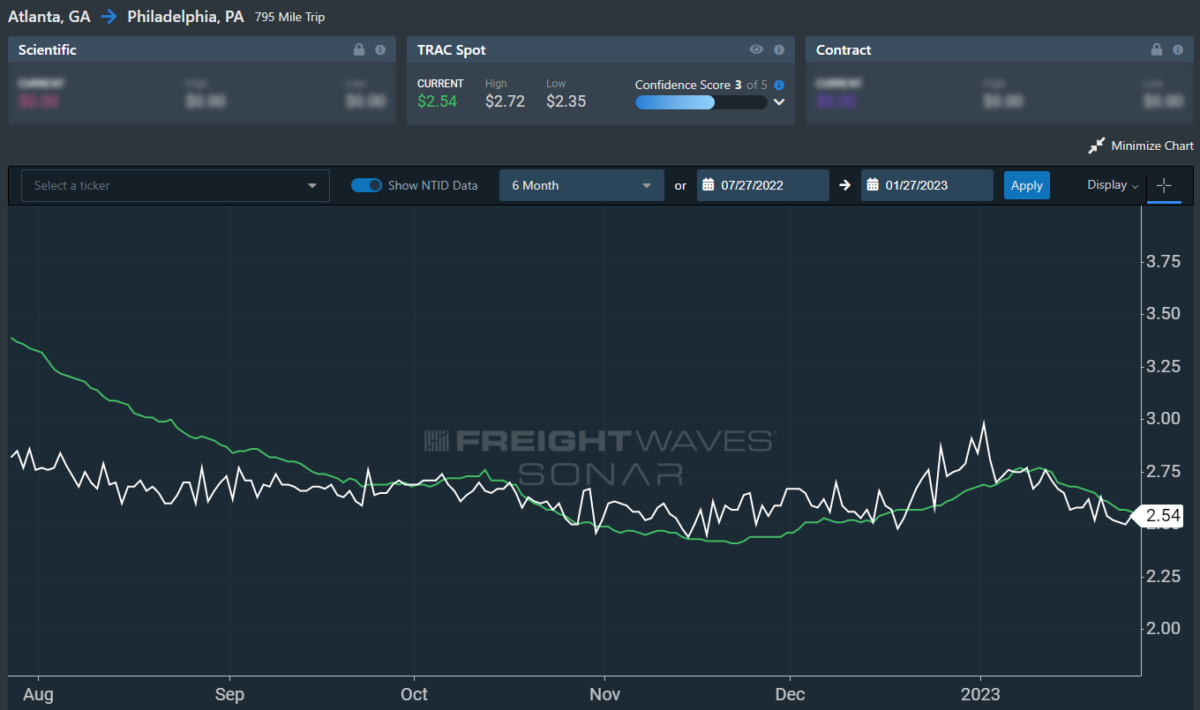
To learn more about FreightWaves TRAC, click here.
On the East Coast, especially out of Atlanta, rates are declining more quickly but remain in line with the NTID. The FreightWaves TRAC rate from Atlanta to Philadelphia fell 11 cents per mile this week to reach $2.54. Except for the recent holiday run, rates along this lane have been dropping stepwise since mid-July, when the TRAC rate was $3.48 per mile.
For more information on the FreightWaves Passport, please contact Michael Rudolph at mrudolph@freightwaves.com or Tony Mulvey at tmulvey@freightwaves.com.
The post Markets are bad, but they could be worse appeared first on FreightWaves.
Source: freightwaves - Markets are bad, but they could be worse
Editor: Michael Rudolph