Freight News:
June bugs and gold bugs
This week’s FreightWaves Supply Chain Pricing Power Index: 25 (Shippers)
Last week’s FreightWaves Supply Chain Pricing Power Index: 25 (Shippers)
Three-month FreightWaves Supply Chain Pricing Power Index Outlook: 30 (Shippers)
The FreightWaves Supply Chain Pricing Power Index uses the analytics and data in FreightWaves SONAR to analyze the market and estimate the negotiating power for rates between shippers and carriers.
This week’s Pricing Power Index is based on the following indicators:
Hard time factory floor blues
Freight demand was hamstrung this week by Monday’s federal holiday. Since the Outbound Tender Volume Index (OTVI) is a seven-day moving average, any day in which volumes are not moving because most facilities are closed (e.g., Memorial Day) will throw noise into weekly comparisons. Still, accepted volumes were well above levels set in 2019 — the year of the industry’s last recession — and were slightly above 2020’s readings, even if they failed to match the runaway activity of 2021.

SONAR: OTVI.USA: 2023 (white), 2022 (blue) and 2021 (green)
To learn more about FreightWaves SONAR, click here.
This week OTVI, which measures national freight demand by shippers’ requests for capacity fell 10% on a week-over-week (w/w) basis. On a year-over-year (y/y) basis, OTVI is down 14%, yet such y/y comparisons can be colored by significant shifts in tender rejections. OTVI, which includes both accepted and rejected tenders, can be artificially inflated by an uptick in the Outbound Tender Reject Index (OTRI).

SONAR: CLAV.USA: 2023 (white), 2022 (blue) and 2021 (green)
To learn more about FreightWaves SONAR, click here.
Contract Load Accepted Volumes (CLAV) is an index that measures accepted load volumes moving under contracted agreements. In short, it is similar to OTVI but without the rejected tenders. Looking at accepted tender volumes, we see a dip of 10.5% w/w as well as a fall of 8.7% y/y. This y/y difference confirms that actual cracks in freight demand — and not merely OTRI’s y/y decline — are driving OTVI lower.
Back-to-school demand among retailers is, on the whole, surprisingly healthy. A look at U.S. imports of notebooks and lunch boxes in May reveals demand trends in line with or exceeding 2019. There are two caveats, however. First, import data in these categories was weaker than 2022 — such weakness is to be expected, given that last year saw a wave of school reopenings following pandemic lockdowns. Second, import data for backpacks is noticeably weaker now than in 2019. Backpacks are the closest this season gets to a big-ticket item, consumer electronics exempted. This decline in backpack demand could suggest that families are tightening their budgets by reusing backpacks.
Despite these caveats, supply chain software-as-a-service provider Descartes feels optimistic that February marked the bottom for ocean imports. As a relative outsider to this segment, I am somewhat puzzled by this claim: Of course February was a low point, given the celebration of Lunar New Year — during which manufacturing output and export activity was disrupted by holiday closures — by China and other Asian exporters. That March and April showed stronger volumes than February is not inspiring in itself.
Per the Freightos Baltic Index, ocean container rates from China to the U.S. are near 2019 levels, lacking any display of growth one would expect from inflation alone. And even if Descartes is correct that retailers are successfully burning off excess inventory — a dubious statement when looking upstream, as wholesale inventory/sales ratios were at their highest (outside of a recession) in March — these retailers are surely factoring in the current infirmity of consumers’ health in their new orders. So though I hope to be proven wrong, I am unconvinced that the ocean and truckload markets will see a quick return to form anytime soon.
One last round of bad news to cap this week: China and the U.S. both posted terrible data from their respective industrial economies. China’s Purchasing Managers’ Index (PMI) fell below expectations in May to 48.8, a reading that points to contraction. Not to put too fine a point on it, but China’s official releases of economic data tend to be more … optimistic than reality might otherwise indicate, so May’s already-dismal reading could be even worse than it seems. Meanwhile, the U.S. Manufacturing PMI slipped to 48.4 in May. Data from the Institute for Supply Management (ISM) saw new orders fall to their lowest level since the pandemic lockdowns of 2020.

SONAR: Outbound Tender Volume Index – Weekly Change (OTVIW).
To learn more about FreightWaves SONAR, click here.
Of the 135 total markets, only 18 reported weekly increases in tender volume, albeit while being saddled by the null day earlier this week.
Despite posting a weekly contraction in freight volume, Detroit came out a winner as its local OTVI only fell 0.85% w/w. Given the aforementioned decay of manufacturing conditions, the fact that Detroit greatly outperformed the national OTVI is certainly impressive. Notably, transportation equipment was one of the few industries that saw growth in production and employment in May’s release of the ISM PMI, though weakness in the automotive credit market is likely to halt this growth sooner rather than later.
By mode: Unsurprisingly, both dry van and reefer volumes suffered from the holiday pause. The Van Outbound Tender Volume Index (VOTVI) fell 10.5% w/w, while the Reefer Outbound Tender Volume Index (ROTVI) tumbled 11.6% w/w. The relatively good news is that ROTVI outpaced 2022 for the majority of May, even though reefer tender rejections were three times higher last year.
And another one gone …
Rough tidings came with Memorial Day, as tender rejections barely broke above 3% and quickly fell afterward. This holiday should be the tightest period capacity-wise until July 4, so there is little hope for noteworthy growth in OTRI around the corner. This underperformance, meanwhile, has kept the PPI at 25 because it shows that carriers are unable to capitalize on seasonal shifts in pricing power momentum.

SONAR: OTRI.USA: 2023 (white), 2022 (blue) and 2021 (green)
To learn more about FreightWaves SONAR, click here.
Over the past week, OTRI, which measures relative capacity in the market, fell to 2.96%, a change of 25 basis points (bps) from the week prior. OTRI is now 562 bps below year-ago levels, with y/y comparisons becoming only more favorable as the year progresses.
Another midsized carrier filed for bankruptcy this past week, citing the one-two punch of higher operating costs and lower revenues as the cause behind its filing. Peace Equipment, a Texan carrier that had been operating since 2016, had 38 drivers and 27 power units that hauled a mixture of refrigerated produce and standard dry van freight. Meanwhile, San Francisco-based CloudTrucks, a company that leased owner-operators onto its authority and provided credit solutions to drivers, has laid off approximately 40% of its workforce, according to a source with knowledge of the matter.

SONAR: WRI (color)
To learn more about FreightWaves SONAR, click here.
The map above shows the Weighted Rejection Index (WRI), the product of the Outbound Tender Reject Index — Weekly Change and Outbound Tender Market Share, as a way to prioritize rejection rate changes. As capacity is generally finding freight this week, only one region posted a blue market, which are usually the ones to focus on.
Of the 135 markets, 49 reported higher rejection rates over the past week, though 38 of those saw increases of only 100 or fewer bps.

To learn more about FreightWaves SONAR, click here.
By mode: Leave it to flatbeds to be contrarians. In spite of the general decline of tender rejections, and in spite of the poor signals broadcast from the industrial sector, the Flatbed Outbound Tender Reject Index (FOTRI) jumped 493 bps w/w to 15.3%. Vans and reefers, however, saw contraction in line with the overall OTRI: The Van Outbound Tender Reject Index (VOTRI) fell 30 bps w/w to 2.74%, while the Reefer Outbound Tender Reject Index (ROTRI) slid 65 bps w/w to 3.15%.
Contract rates contract, spot rates stable
Unlike tender rejections, spot rates managed to retain their gains made over the past three weeks and are now holding steady near levels set at the start of April. All-in spot rates have the outside possibility of being juiced by higher fuel costs, if diesel prices reverse their long stretch of declines after OPEC+’s meeting on Sunday.
In early April, OPEC+ announced a series of production cuts that momentarily gave a boost to crude oil prices, though recessionary fears quickly outbalanced the brief rally. Looking at the market’s fundamentals, these fears are quite potent indeed, as nearly all analysts (including the U.S.’ own Energy Information Administration) predict that global oil demand will outpace supply in the back half of 2023. While traders expect OPEC+’s production quotas to remain unchanged in June, recent comments from the Minister of Energy of Saudi Arabia — the driving force behind OPEC+ — hinted at a surprise round of cuts, especially as major media outlets have not been permitted access to this month’s meetings.

SONAR: National Truckload Index, 7-day average (white; right axis) and dry van contract rate (green; left axis).
To learn more about FreightWaves SONAR, click here.
This week, the National Truckload Index (NTI) — which includes fuel surcharges and other accessorials — rose 2 cents per mile to $2.25. Rising linehaul rates weighed more heavily than a slight decline in diesel prices, as the linehaul variant of the NTI (NTIL) — which excludes fuel surcharges and other accessorials — rose 3 cents per mile w/w to $1.63.
This good news does not extend to contract rates, which exclude fuel surcharges and other accessorials like the NTIL. Last year on June 2, contract rates posted an all-time high of $2.98 per mile. Of course, for those carriers that were able to lock in rates valid for 12 months at that peak, they now have to reckon with the nearly 20% decline in rates since then. Contract rates, which are reported on a two-week delay, fell 4 cents per mile w/w to $2.39 — in line with levels last seen in April 2021.

To learn more about FreightWaves SONAR, click here.
The chart above shows the spread between the NTIL and dry van contract rates, revealing the index has fallen to all-time lows in the data set, which dates to early 2019. Throughout that year, contract rates exceeded spot rates, leading to a record number of bankruptcies in the space. Once COVID-19 spread, spot rates reacted quickly, rising to record highs on a seemingly weekly basis, while contract rates slowly crept higher throughout 2021.
Despite this spread narrowing significantly over the first few weeks of the year, tightening by 20 cents per mile in January, it has continued to widen again. Since linehaul spot rates remain 84 cents below contract rates, there is still plenty of room for contract rates to decline — or for spot rates to rise — in the coming months.

To learn more about FreightWaves TRAC, click here.
The FreightWaves TRAC spot rate from Los Angeles to Dallas, arguably one of the densest freight lanes in the country, continues to distance itself from April’s floor. Over the past week, the TRAC rate rose 2 cents per mile to $2.05 — still a far cry from its year-to-date high of $2.39. The NTID, which has risen to $2.28, is handily outpacing rates from Los Angeles to Dallas.
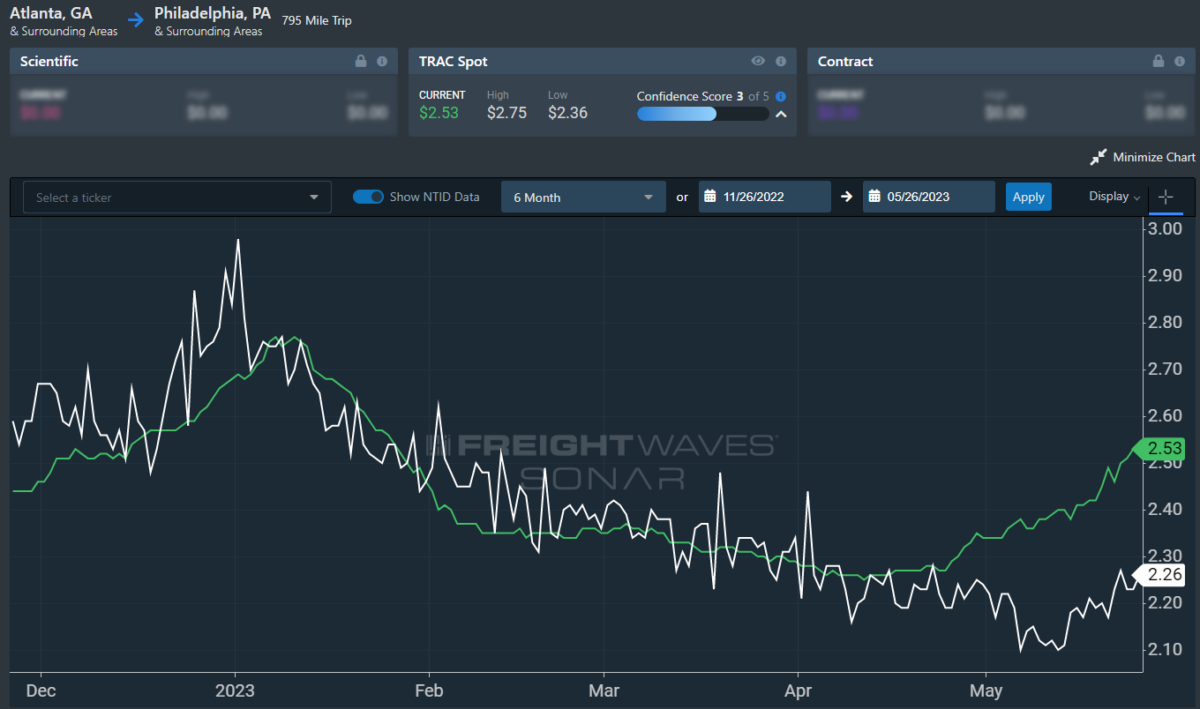
To learn more about FreightWaves TRAC, click here.
On the East Coast, especially out of Atlanta, rates are continuing to rally, outpacing the NTID. The FreightWaves TRAC rate from Atlanta to Philadelphia rose 14 cents per mile w/w to $2.67. This current bull run, which started at the end of April, is making north-to-south lanes in the East far more attractive than West Coast alternatives.
For more information on FreightWaves’ research, please contact Michael Rudolph at mrudolph@freightwaves.com or Tony Mulvey at tmulvey@freightwaves.com.
The post June bugs and gold bugs appeared first on FreightWaves.
Source: freightwaves - June bugs and gold bugs
Editor: Michael Rudolph