Freight News:
Freight markets are feeling an early freeze
This week’s FreightWaves Supply Chain Pricing Power Index: 35 (Shippers)
Last week’s FreightWaves Supply Chain Pricing Power Index: 35 (Shippers)
Three-month FreightWaves Supply Chain Pricing Power Index Outlook: 30 (Shippers)
The FreightWaves Supply Chain Pricing Power Index uses the analytics and data in FreightWaves SONAR to analyze the market and estimate the negotiating power for rates between shippers and carriers.
This week’s Pricing Power Index is based on the following indicators:
Volumes are unable to recover from their holiday break
Signals from the Outbound Tender Volume Index (OTVI) will be a bit erratic until next week as the holiday noise from Thanksgiving will be skewing volume levels. Since OTVI is calculated as a seven-day moving average, and since freight demand on Thanksgiving was effectively absent, the recent dip should not be alarming by itself.
Nevertheless, demand from retail shippers has been consistently quiet this year. The month of December is an unusual one in that overall volumes take a hit during a full week (from Christmas to New Year’s Eve). Even so, much of the freight that moves in this month is fairly urgent, which can allow well-positioned carriers to negotiate for higher rates.
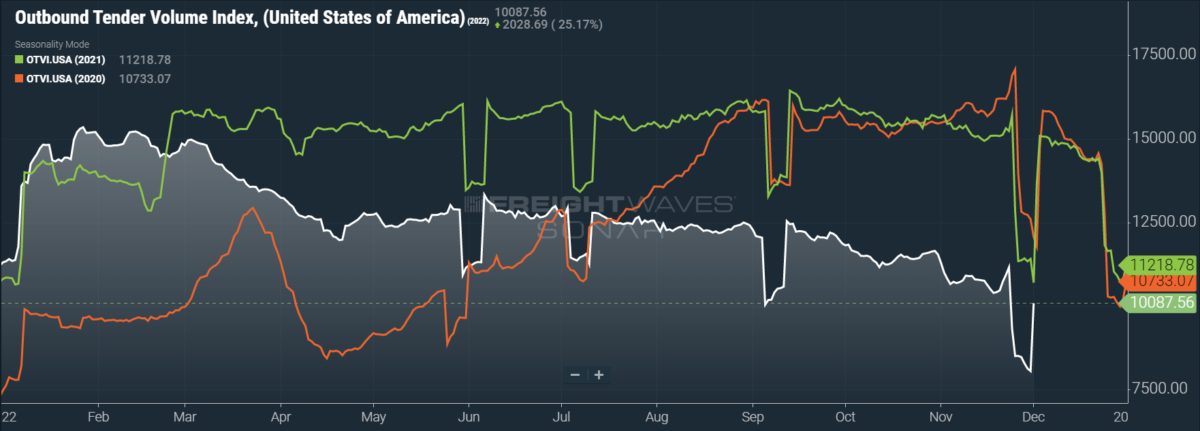
SONAR: OTVI.USA: 2022 (white), 2021 (green) and 2020 (orange)
To learn more about FreightWaves SONAR, click here.
OTVI fell an unsurprising 3.96% on a two-week basis as holiday noise affects comps made against last week’s data. On a year-over-year (y/y) basis, OTVI is down 26.08%, although such y/y comparisons can be colored by significant shifts in tender rejections. OTVI, which includes both accepted and rejected tenders, can be artificially inflated by an uptick in the Outbound Tender Reject Index (OTRI).
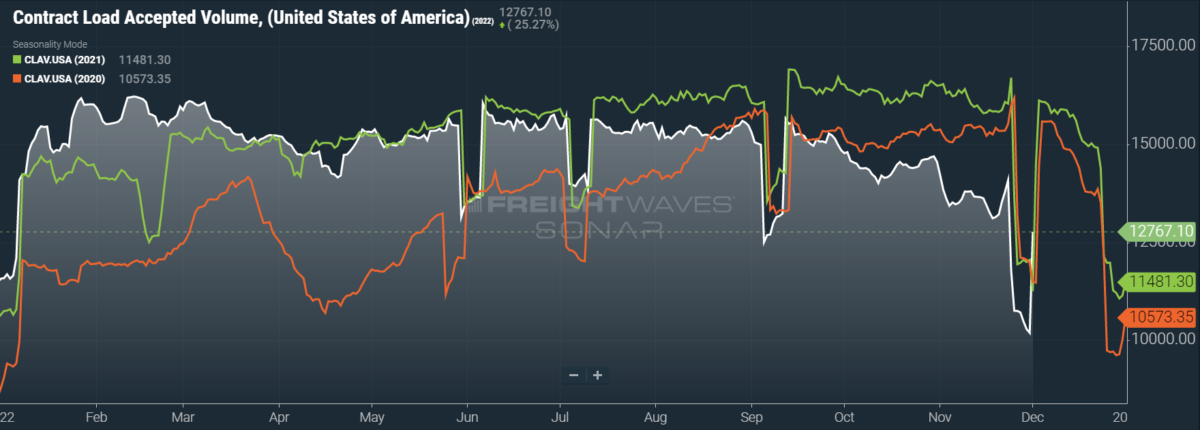
SONAR: CLAV.USA: 2022 (white), 2021 (green) and 2020 (orange)
To learn more about FreightWaves SONAR, click here.
Contract Load Accepted Volumes (CLAV) is an index that measures accepted load volumes moving under contracted agreements. In short, it is similar to OTVI but without the rejected tenders. Looking at accepted tender volumes, we see a dip of 3.74% on a two-week basis as well as a fall of 11.74% y/y. This y/y difference confirms that actual cracks in freight demand — and not merely OTRI’s y/y decline — are driving OTVI lower.
A recent release from the Bureau of Economic Analysis shows that inflation-adjusted consumer spending jumped 0.5% m/m in October — the largest such increase since January. This news is surely welcome to the retailers that held a slew of promotions in the month, reflecting consumers’ eagerness to start holiday shopping far earlier than usual. Preliminary data from Adobe Analytics, however, reveals much weaker post-Thanksgiving spending than in previous years. While online retail sales on Black Friday broke a new record of $9.12 billion, this historic figure sidesteps the effect of rampant inflation. While these Black Friday numbers mark an improvement of 2.3% y/y, e-commerce prices (per the Consumer Price Index) were up 7.7% y/y in October.
Even if 2022 shakes out to be a banner year for holiday shopping, there is still the question of whether consumers will be able to afford their new purchases. As mentioned several times in this column, the growing amount of credit card debt is alarming. To make matters worse, the already untenable revolving credit data does not cover “buy now, pay later” programs, which have seen a surge of adoption in recent months. The final shoe to drop will, of course, be unemployment rates. Should people find themselves on the hook for monthly payments without means to pay for them, it will create a dispiriting environment for retailers.
In a very grim sense, however, a wave of returns and defaults could be a boon to the reverse logistics industry. Reverse logistics has seen continued growth ever since the pandemic catalyzed widespread usage of e-commerce platforms. The post-holiday season in January and February is almost always a blessing to reverse logistics as many consumers sort out their budgets after their purchases.
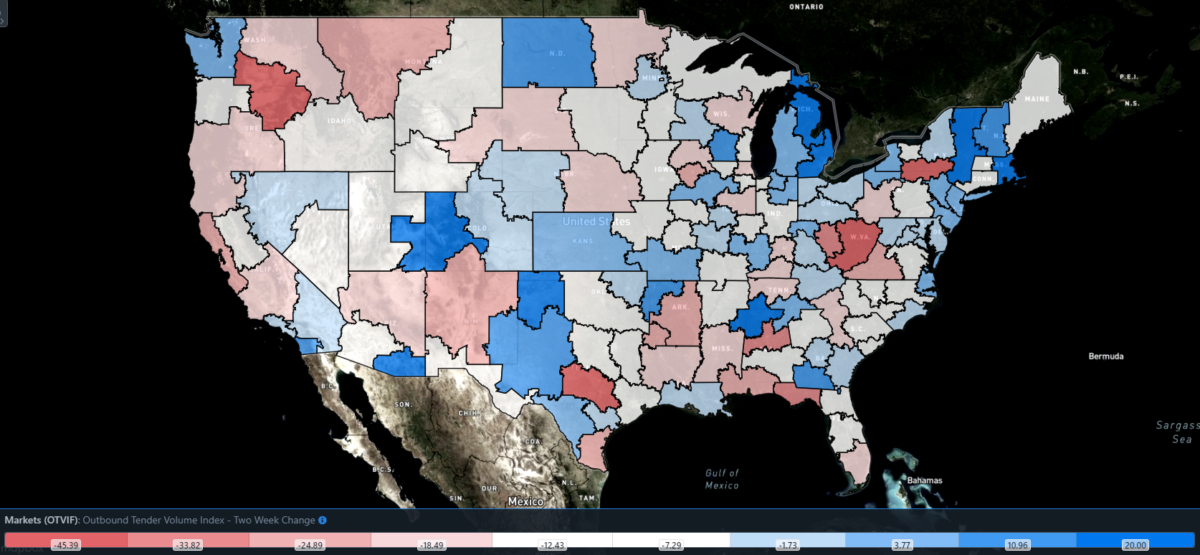
SONAR: Outbound Tender Volume Index – Two-Week Change (OTVIF).
To learn more about FreightWaves SONAR, click here.
Of the 135 total markets, 45 reported increases in tender volume on a two-week basis as freight demand took a vacation during Thanksgiving.
Detroit was one of the only major markets that saw freight demand ramp up on a weekly basis while tender data was suffering from holiday noise. On a two-week basis, Detroit’s OTVI rose 23.2%. Since the city’s market is historically home to the automobile industry, this recent bump in freight activity is good news for domestic manufacturers in the region.
By mode: Taken on a two-week basis, both reefers and dry vans saw comparable declines in tender volume. The Reefer Outbound Tender Volume Index (ROTVI) was the worst performer of the two, as ROTVI was down 3.6% on a two-week basis. The Van Outbound Tender Volume Index (VOTVI) was on a similar trend, sliding 2.74% on a two-week basis. While VOTVI and ROTVI are down a respective 24.9% y/y and 29.3% y/y, the bulk of this difference stems from rapidly declining tender rejections in both modes.
Rejection rates resume their long decline
It is disturbing that OTRI fell during the holidays, given that Thanksgiving is usually a time when carriers take a break from the road. To be sure, OTRI did rebound from its earlier foray below 4% in the middle of the month, but it has regained its downward momentum as of last Monday. Keep in mind that 2019, the year of the trucking industry’s last recession, saw OTRI hit a yearly low of 3.78%. For all intents and purposes, this figure should be considered OTRI’s floor, pandemic-induced shockwaves aside.
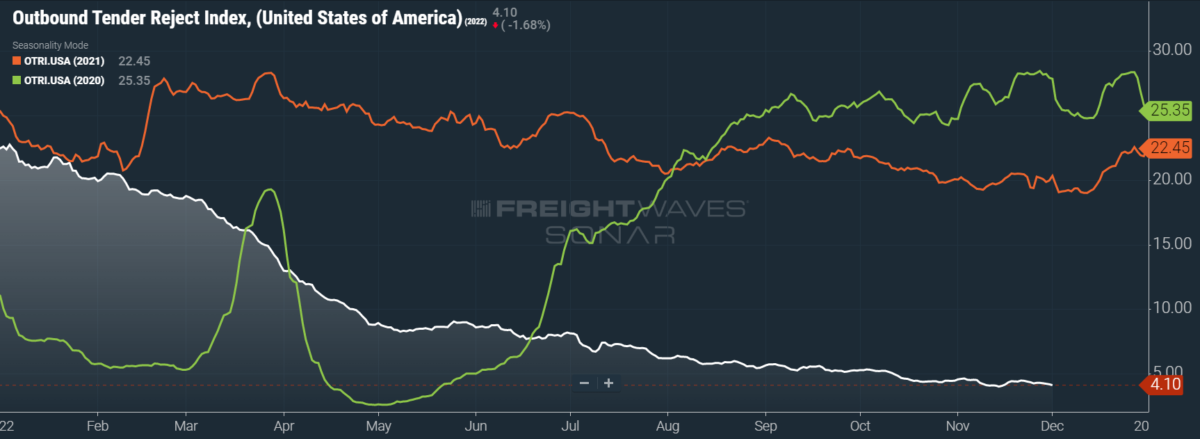
SONAR: OTRI.USA: 2022 (white), 2021 (orange) and 2020 (green)
To learn more about FreightWaves SONAR, click here.
Over the past week, OTRI, which measures relative capacity in the market, fell to 4.1%, a change of 23 basis points (bps) from the week prior. OTRI is now 1,623 bps below year-ago levels.
Both chambers of Congress voted on separate bills to forestall an impending strike by the railroad labor unions that remain holdouts. The House of Representatives’ bill, which passed 290-137, sought a compromise on guaranteed sick days, the ostensible sticking point for the unions. Although the measure fell short of the union’s demand for 15 sick days per year, it met the unions halfway, promising seven days of sick leave.
Unfortunately for the rail unions, the Senate’s separate measure, which passed 80-15, does not include such guaranteed sick days and was signed into law by President Biden on Friday morning. The unions could still stage a “wildcat” walkout, a type of strike that would expose the unions to legal challenges and fines. If the unions do settle on such a walkout, it could provide a short-term boost to truckload spot rates as rail freight is instead moved over the road. But much of rail freight, such as bulk materials, is not eligible for such a conversion. Truckload carriers would also face unexpected interruptions and expenses into Q1 2023 if a rail strike comes to pass.
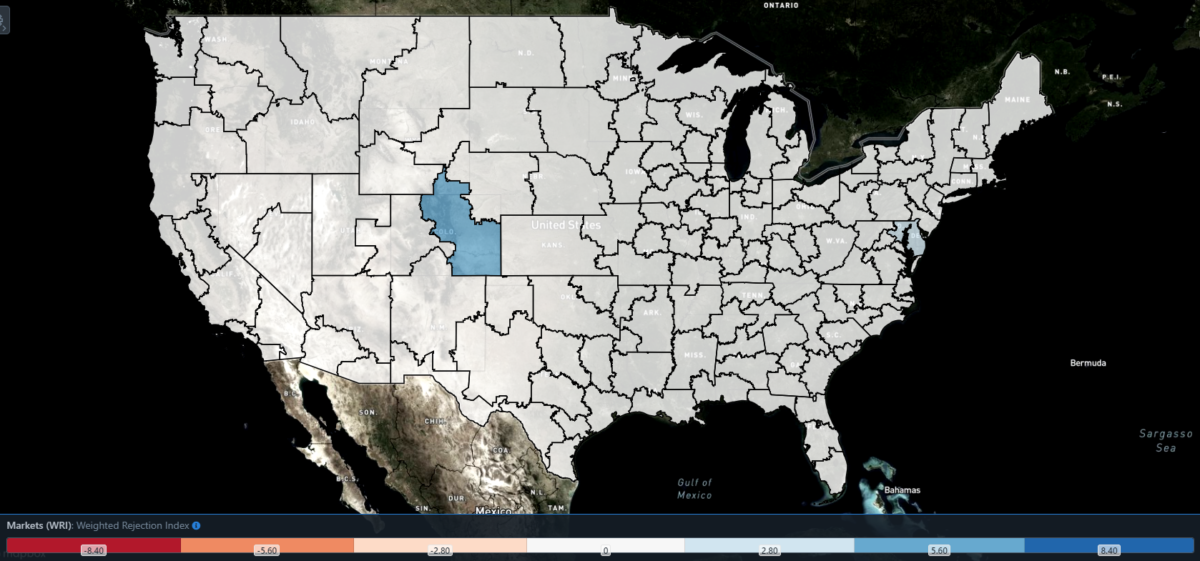
SONAR: WRI (color)
To learn more about FreightWaves SONAR, click here.
The map above shows the Weighted Rejection Index (WRI), the product of the Outbound Tender Reject Index — Weekly Change and Outbound Tender Market Share, as a way to prioritize rejection rate changes. As capacity is generally finding freight, only Colorado posted a blue market, which are usually the ones to focus on.
Of the 135 markets, 50 reported higher rejection rates over the past week, though 36 of those reported increases of only 100 or fewer bps.
Tender rejections did move up in Denver this week, even if not to mile-high heights. Denver’s OTRI rose 388 bps over the past week to 7.31%. This latest rise pushes the market’s OTRI to a place among the highest for major outbound markets, though Denver did see volumes dip 0.15% on a two-week basis. The neighboring market of Grand Junction, Colorado, also saw its OTRI rise 172 bps on a weekly basis to 8.11%, though it is a much smaller market than Denver.
To learn more about FreightWaves SONAR, click here.
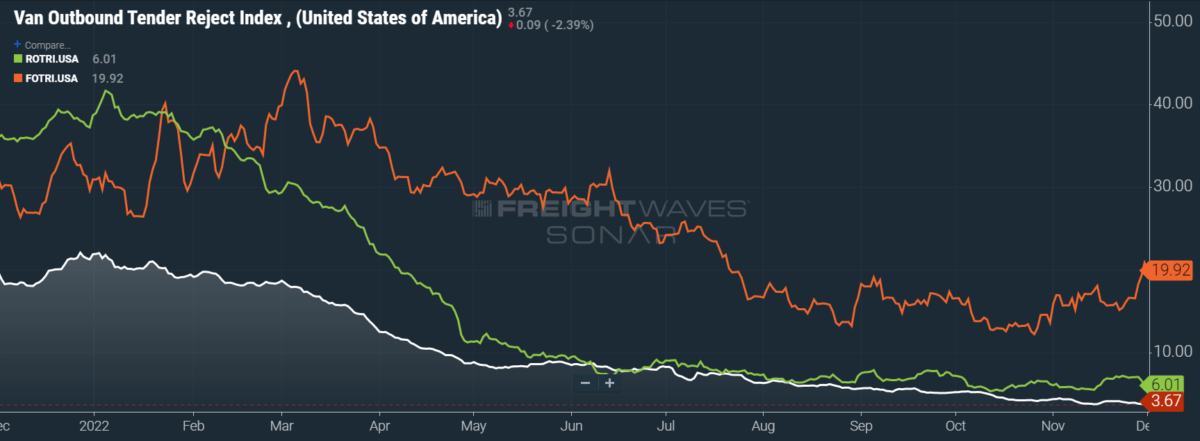
By mode: Flatbeds were the only mode that obeyed seasonal trends in rejection rates, which are normally goosed during holidays. The Flatbed Outbound Tender Reject Index (FOTRI) rose 384 bps over the past week to 19.92%, coming down off Wednesday’s peak at 20.85% — a level not seen since late July. Even so, there are not many sources of upward pressure on flatbed rejection rates, as industrial production fell slightly in October and housing starts continue to decline.
Unsurprisingly, both reefers and dry vans saw tender rejection rates deteriorate further. The Reefer Outbound Tender Reject Index (ROTRI) fell 106 bps on a weekly basis to 6.01%, and ROTRI is unlikely to see a rise until cold weather shifts goods that are normally shipped in dry vans to a temperature-controlled environment. The Van Outbound Tender Reject Index (VOTRI) lost 30 bps over the past week, slumping to 3.67%. This latest reading puts VOTRI dangerously close to the absolute low of early 2020, when VOTRI was 2.55%.
Spot rates are stuffed from the holidays
Unlike tender rejections, spot rates did see a notable boost from the Thanksgiving holiday. Diesel prices have finally started to decline, so this latest rise can safely be attributed to holiday-induced rate increases. While diesel prices are linked to crude oil prices, which fell dramatically among fears of Chinese demand destruction, there is an ongoing shortage of diesel that is seeing inventories at their lowest level for this time of year since 1951. The G7 coalition, which includes the United States and several European countries, is about to put its price cap on Russian oil into effect on Monday, further threatening global supply of distillate products like diesel.
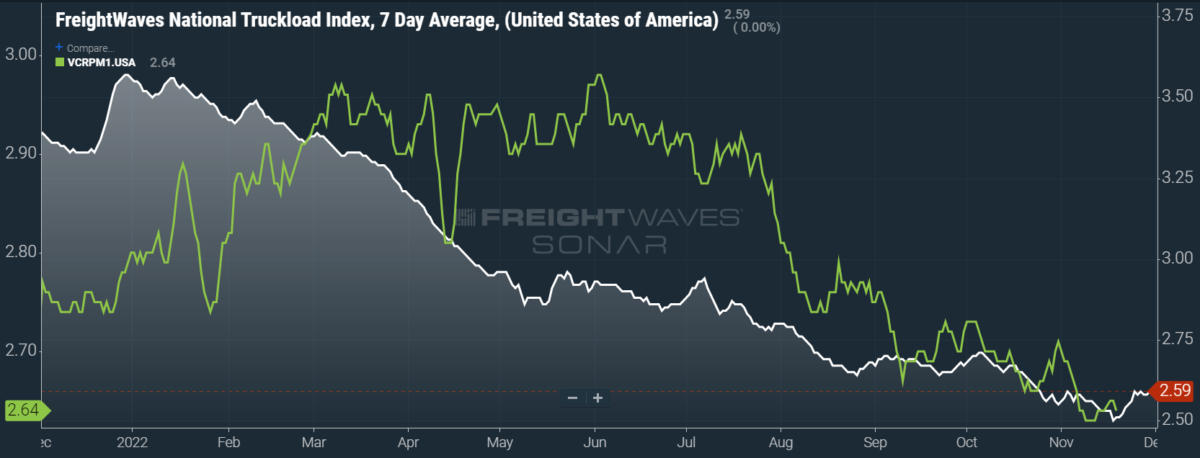
SONAR: National Truckload Index, 7-day average (white; right axis) and dry van contract rate (green; left axis).
To learn more about FreightWaves SONAR, click here.
This week, the National Truckload Index (NTI), which includes fuel surcharges and other accessorials, did not see a weekly change but did rise 9 cents per mile on a two-week basis to $2.59. When the NTI dipped to $2.50 per mile in mid-November, it was at its lowest level since August 2020. But the latest gains do put the NTI back at the levels of January 2021 — a backhanded compliment if there ever was one.
The linehaul variant of the NTI (NTIL), which excludes fuel surcharges and other accessorials, rose 1 cent per mile on a weekly and 11 cents per mile on a two-week basis. Strong linehaul rates should remain a presence (to a greater or lesser extent) for the remainder of the year, as carriers typically take advantage of holiday pricing.
Contract rates, which are reported on a two-week delay, have yet to see any effect from Thanksgiving. It is not unusual for contract rates to bake in some holiday pricing, though shippers with both foresight and the means to frontload freight will avoid pushing too many shipments in this period. Contract rates, which exclude fuel surcharges and other accessorials like the NTIL, gained 1 cent per mile to hit $2.64. At present, contract rates have not only lost all of the gains made in 2022 but also those made in the second half of 2021. But even after their current decline, contract rates still have room to fall further and will likely do so during Q1 2023.
To learn more about FreightWaves SONAR, click here.
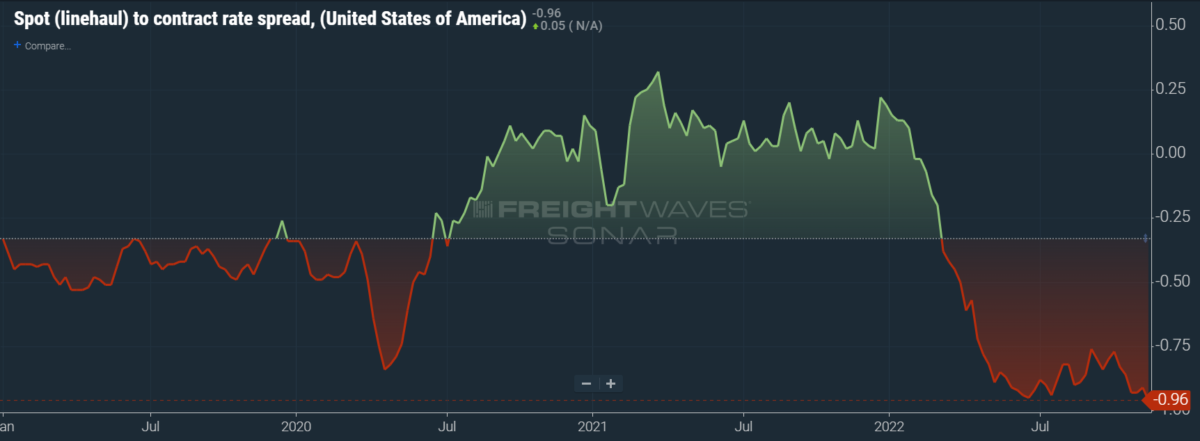
The chart above shows the spread between the NTIL and dry van contract rates, showing the index has continued to fall to all-time lows in the data set, which dates to early 2019. Throughout that year, contract rates exceeded spot rates, leading to a record number of bankruptcies in the space. Once COVID-19 spread, spot rates reacted quickly, rising to record highs on a seemingly weekly basis, while contract rates slowly crept higher throughout 2021.
As the linehaul spot rate remains 96 cents below contract rates, there is still runway for contract rates to decline throughout the next six months.
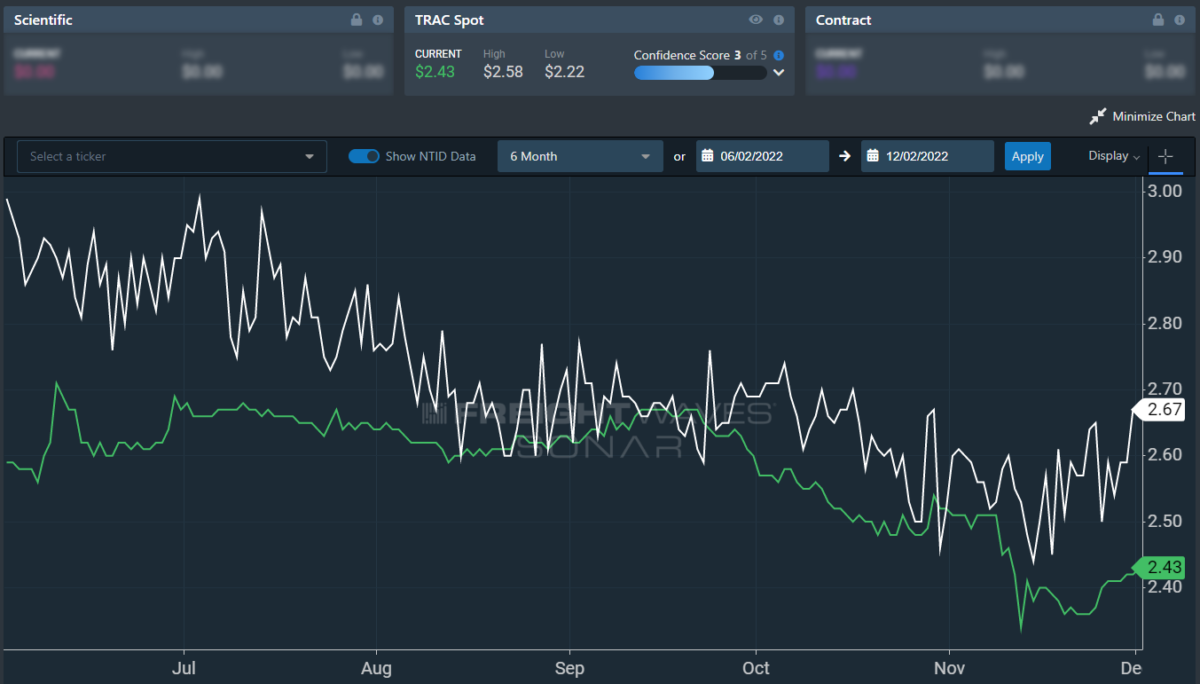
To learn more about FreightWaves TRAC, click here.
The FreightWaves TRAC spot rate from Los Angeles to Dallas, arguably one of the densest freight lanes in the country, is rebounding from its previous floor. Over the past week, the TRAC rate rose 6 cents per mile w/w to $2.43. The daily NTI (NTID), which has also risen to $2.67, continues to outpace rates from Los Angeles to Dallas.
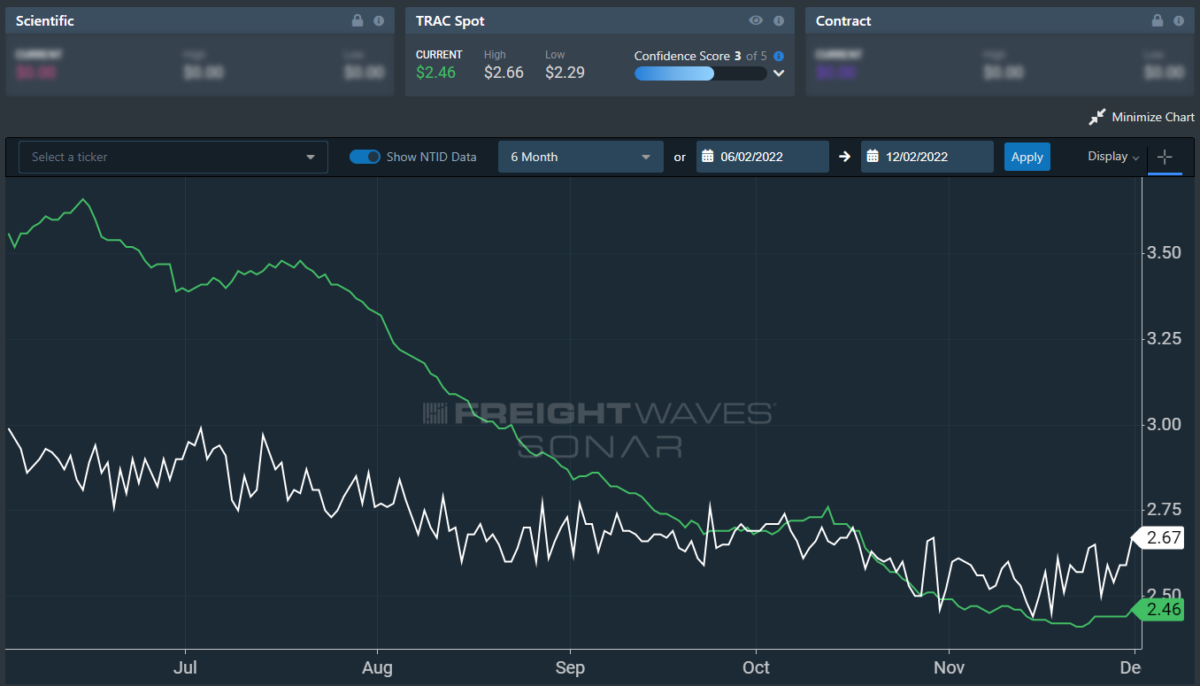
To learn more about FreightWaves TRAC, click here.
On the East Coast, especially out of Atlanta, rates did not see as drastic of a holiday boost but are likewise underperforming against the NTID. The FreightWaves TRAC rate from Atlanta to Philadelphia rose 2 cents per mile this week to reach $2.46. Rates along this lane have been dropping stepwise since mid-July, when the TRAC rate was $3.48 per mile.
For more information on the FreightWaves Passport, please contact Kevin Hill at khill@freightwaves.com, Tony Mulvey at tmulvey@freightwaves.com or Michael Rudolph at mrudolph@freightwaves.com.
The post Freight markets are feeling an early freeze appeared first on FreightWaves.
Source: freightwaves - Freight markets are feeling an early freeze
Editor: Michael Rudolph