Freight News:
Contract market contracts, squeezing larger carriers
This week’s FreightWaves Supply Chain Pricing Power Index: 35 (Shippers)
Last week’s FreightWaves Supply Chain Pricing Power Index: 35 (Shippers)
Three-month FreightWaves Supply Chain Pricing Power Index Outlook: 30 (Shippers)
The FreightWaves Supply Chain Pricing Power Index uses the analytics and data in FreightWaves SONAR to analyze the market and estimate the negotiating power for rates between shippers and carriers.
This week’s Pricing Power Index is based on the following indicators:
Volumes recover from Thanksgiving lethargy
Contrary to popular opinion, December is not a peak season for freight. True, the freight that needs to be moved in this month typically has greater urgency than usual, which does put upward pressure on carrier rates. But peak truckload volumes are largely influenced by maritime imports, which historically peak between July and September. With the benefit of hindsight (that confirms FreightWaves’ foresight), we see that 2022 brought a decline in ocean volumes that was masked by congestion resolving at the ports.
Since retail freight has an outsized effect on tender volumes during Q4, and since retailers are primarily focused on clearing out their bloated inventory rather than restocking, truckload volumes are suffering. Yet these larger trends are not the direct cause of the current stagnation in the Outbound Tender Volume Index (OTVI), which has seen muted post-Thanksgiving recoveries in 2019, 2020 and 2021 alike.
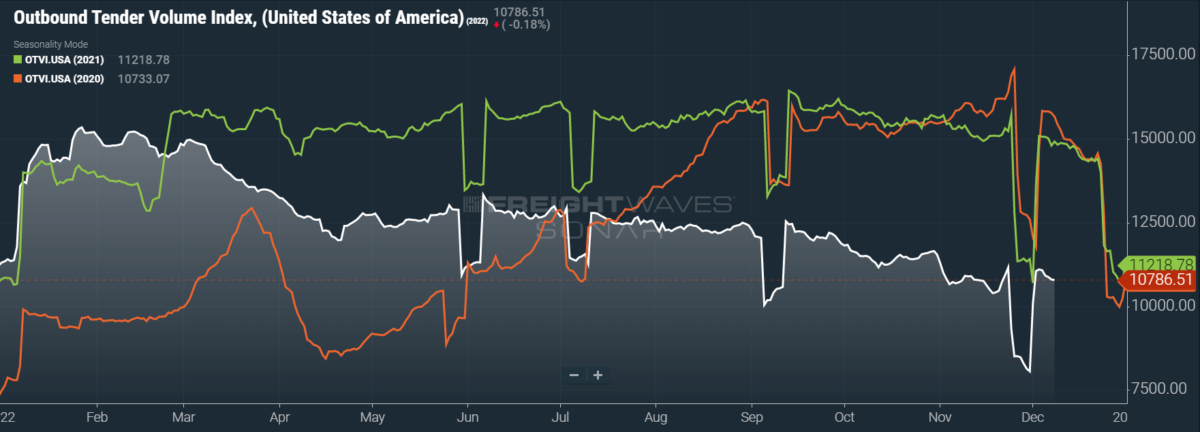
SONAR: OTVI.USA: 2022 (white), 2021 (green) and 2020 (orange)
To learn more about FreightWaves SONAR, click here.
OTVI did rise 6.93% on a week-over-week (w/w) basis, albeit against easy comps. On a year-over-year (y/y) basis, OTVI is down 27.28%, although such y/y comparisons can be colored by significant shifts in tender rejections. OTVI, which includes both accepted and rejected tenders, can be artificially inflated by an uptick in the Outbound Tender Reject Index (OTRI).
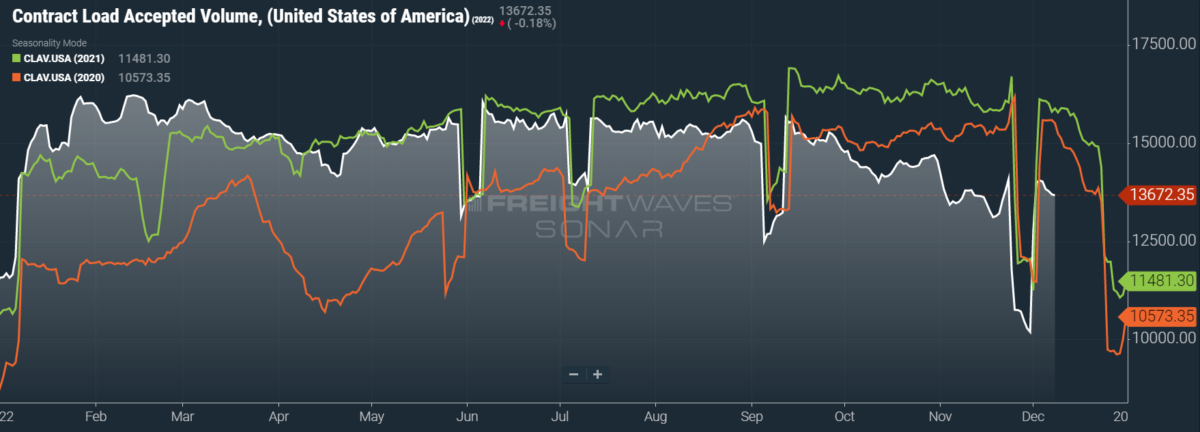
SONAR: CLAV.USA: 2022 (white), 2021 (green) and 2020 (orange)
To learn more about FreightWaves SONAR, click here.
Contract Load Accepted Volumes (CLAV) is an index that measures accepted load volumes moving under contracted agreements. In short, it is similar to OTVI but without the rejected tenders. Looking at accepted tender volumes, we see a bump of 7.1% w/w as well as a fall of 13.9% y/y. This y/y difference confirms that actual cracks in freight demand — and not merely OTRI’s y/y decline — are driving OTVI lower.
China has proven itself to be a consistently mercurial shipping partner in recent weeks. After years of restrictive lockdowns and other pandemic measures, Chinese protesters voiced their ardent disapproval of the government’s “zero-COVID” policies. The protests initially arose in the northwest city of Urumqi and were triggered by the death of at least 10 citizens in a residential fire, where rescue attempts were hindered by barriers previously installed to enforce quarantine. Yet the protests soon spread to other cities, such as Beijing, Shanghai and Guangzhou, snowballing into a broader critique of the totalitarian government.
Export volumes have been suffering from the frequent lockdowns, as container yards and manufacturing facilities alike have slowed productivity. In response to the recent unrest, China stated that it will begin to relax its COVID restrictions. Seeing as China’s exports fell 8.7% y/y in November — far below the 2% y/y drop anticipated by market analysts — this policy reversal is welcome news to shippers. Even so, freight flow in the country will take some time to recover, and the resurgence of manufacturing activity will provide upward pressure on oil (and thus gasoline and diesel) prices, which have been depressed by weakened Chinese demand.
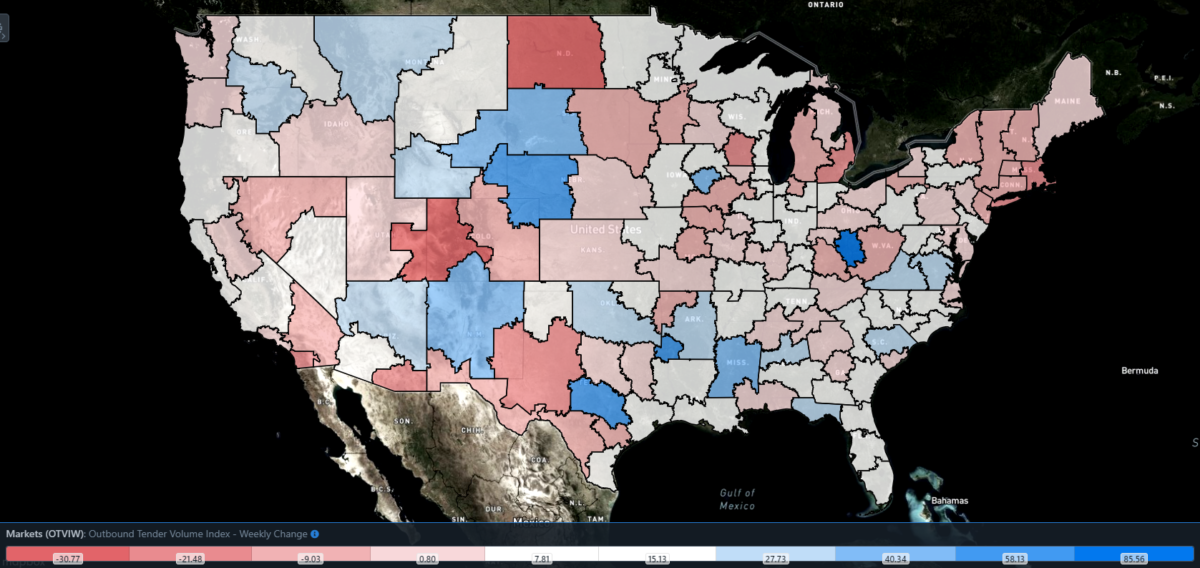
SONAR: Outbound Tender Volume Index – Weekly Change (OTVIW).
To learn more about FreightWaves SONAR, click here.
Of the 135 total markets, 102 reported weekly increases in tender volume as freight demand last week was slow to bounce back from its holiday lull.
Despite these easy w/w comps, however, volumes have fallen in the heavyweight market of Ontario, California. Ontario’s local OTVI dipped 1.95% w/w, which is beyond pitiful. Freight demand in the market has taken a blow from declining imports at the nearby ports of Los Angeles and Long Beach; two weeks prior, the ports had cleared their collective backlog for the first time since October 2020. Such a scenario would have been difficult to imagine a year ago, when over 100 ships were waiting offshore.
By mode: Considering the ease with which they should have outdistanced last week’s levels, reefer volumes are less than impressive. The Reefer Outbound Tender Volume Index (ROTVI) rose only 1.66% w/w, with reefer volumes falling in some major markets like Harrisburg, Pennsylvania, Indianapolis and Fresno, California. December and January should see some gains in reefer demand, as some shippers will shift modes from dry van to reefer in order to protect their freight against cold weather. But such gains have yet to materialize: ROTVI is down 30.23% y/y.
Van volumes’ performance is much more in line with the greater OTVI, though they too are underperforming against it. The Van Outbound Tender Volume Index (VOTVI) is up 5.54% w/w. While OTVI typically sees a notable decline over December — as it did in 2019, 2020 and 2021 — VOTVI is partially exempt from that trend, where dry van demand is usually flat or else dips only slightly. Nevertheless, VOTVI is down 28% y/y.
Rejection rates reach new cycle low
Compounding the dismal performance seen during Thanksgiving, OTRI continued its decline into December, hitting lows not seen since the volatility of the early stages of the pandemic. These pandemic-induced lows stretched OTRI beyond the bounds of its usual peaks and valleys. In 2019, the year of the industry’s last recession, OTRI hit a yearly low of 3.78%. This figure should properly be considered OTRI’s floor — a floor that is quickly approaching.
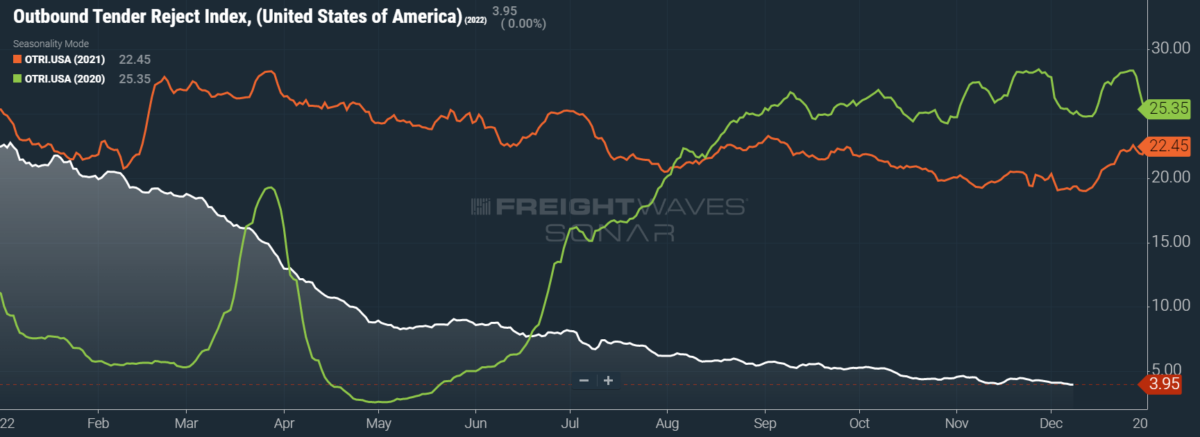
SONAR: OTRI.USA: 2022 (white), 2021 (orange) and 2020 (green)
To learn more about FreightWaves SONAR, click here.
Over the past week, OTRI, which measures relative capacity in the market, fell to 3.95%, a change of 15 basis points (bps) from the week prior. OTRI is now 1,540 bps below year-ago levels.
Orders for new Class 8 trucks fell for a second consecutive month in November, a signal that reflects the current uncertainty around the health of the trucking industry as well as the broader economy. Automotive manufacturers are still reeling from component shortages that have limited OEMs’ order intake over the past two years. Now their orderbooks are fully open, with slots being slowly (but surely) filled by larger fleets seeking to reinvest their profits from 2021.
Somewhat surprisingly, FreightTech could see a healthy performance during 2023. All things being equal, capital expenditures tend to be one of the first budgetary items to be cut when companies enter an industrywide downturn. Yet many FreightTech companies offer an attractive solution to the chaotic, logistical nightmares belonging to the past two years. With transportation spending seeing a rise in prominence over this period, shippers are eager to secure their supply chains against any unforeseen disruptions in the future.
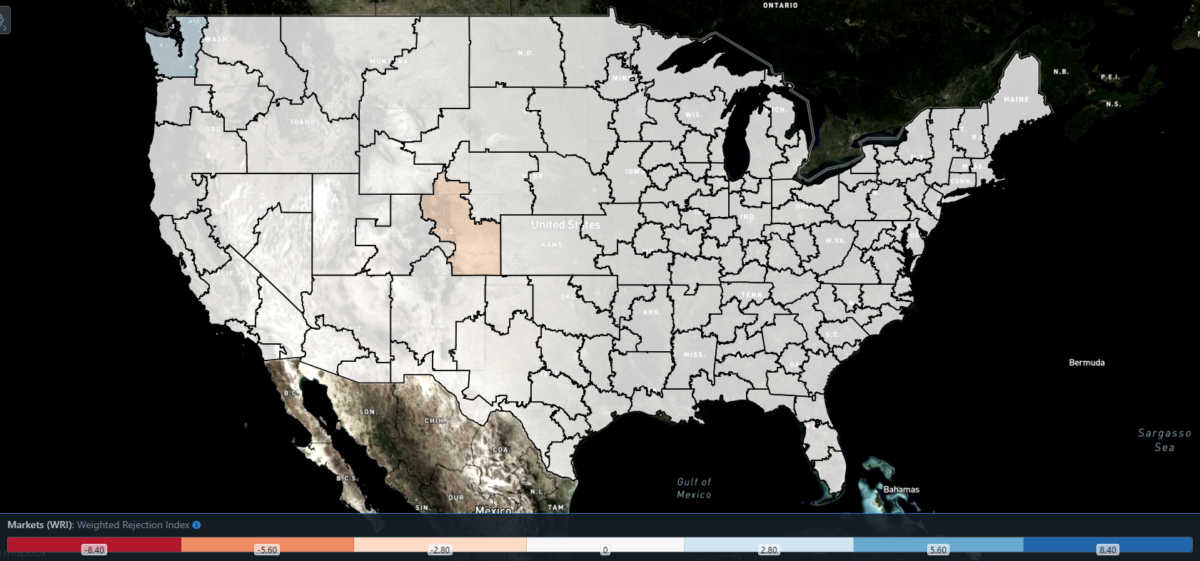
SONAR: WRI (color)
To learn more about FreightWaves SONAR, click here.
The map above shows the Weighted Rejection Index (WRI), the product of the Outbound Tender Reject Index — Weekly Change and Outbound Tender Market Share, as a way to prioritize rejection rate changes. As capacity is generally finding freight, only Washington posted a blue market, which are usually the ones to focus on.
Of the 135 markets, 48 reported higher rejection rates over the past week, though 35 of those reported increases of only 100 or fewer bps.
Tender rejections swelled in Seattle this week, with the market’s local OTRI spiraling 428 bps w/w to 5.37%. Seattle itself is a midsize market that sees a mixture of reefer volumes from its seafood industry and its countless microbreweries as well as traditional freight moving from the Port of Seattle and Canada. The broader market did see reefer volumes explode in November after apple season — Washington produces over half of the nation’s apples.
To learn more about FreightWaves SONAR, click here.
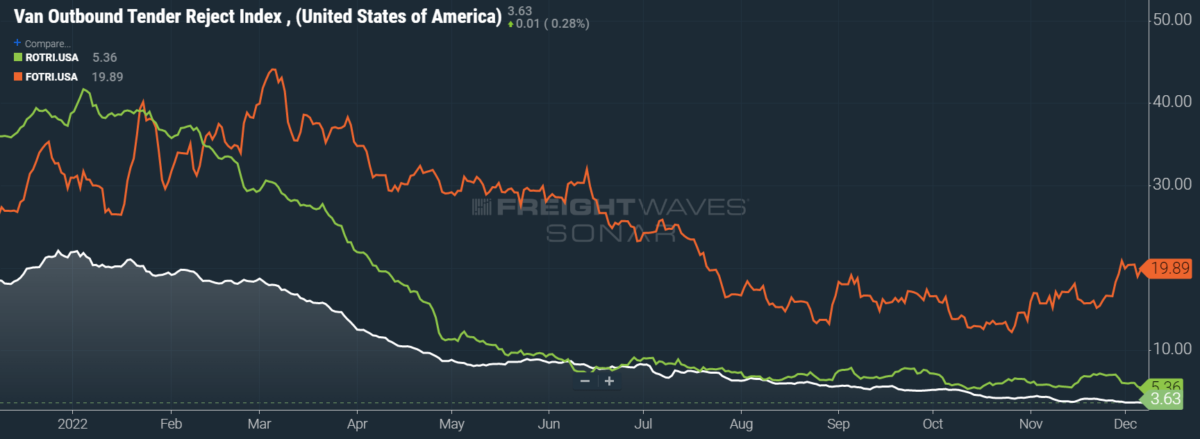
By mode: Reefer rejections have nearly returned to mid-October’s low, which was itself the lowest level ever seen outside of the initial volatility from the pandemic. The Reefer Outbound Tender Reject Index (ROTRI) fell 65 bps w/w to 5.36%. In a normal market, ROTRI and ROTVI alike would see a boost in the upcoming months, when reefers offer protection against inclement winter weather. Needless to say, 2022 is not a normal market and Q1 2023 is unlikely to offer much hope.
Flatbed rejection rates saw a slight decline this week, although they have largely recovered from October’s floor. In my home state of Illinois, it was often joked that there are only two seasons: winter and construction. The two appear to be blending, despite declining homebuilder sentiment and housing starts. The Flatbed Outbound Tender Reject Index (FOTRI) dipped a mere 3 bps w/w to 19.89% — far from both the recent low of 12.2% and 2019’s yearlong average of 8.81%. The Van Outbound Tender Reject Index (VOTRI) saw a similar dip of 4 bps w/w, albeit a dip to nearly its lowest level since May 2020.
Contract rates see brutal tumble during Thanksgiving
Unlike spot rates, which saw a holiday boost that was both historically normal but surprising in this weakened market, contract rates fell on Thanksgiving. To be fair, contract rates — which are reported on a two-week delay — also fell this week in 2021, but did rise in 2018, 2019 and 2020. Since OTRI, which tracks the rejection of contracted loads, likewise fell during Thanksgiving this year, we can guess that shippers took sufficient measures to ensure that their freight would not interrupt the holiday week, thus avoiding holiday rate increases.
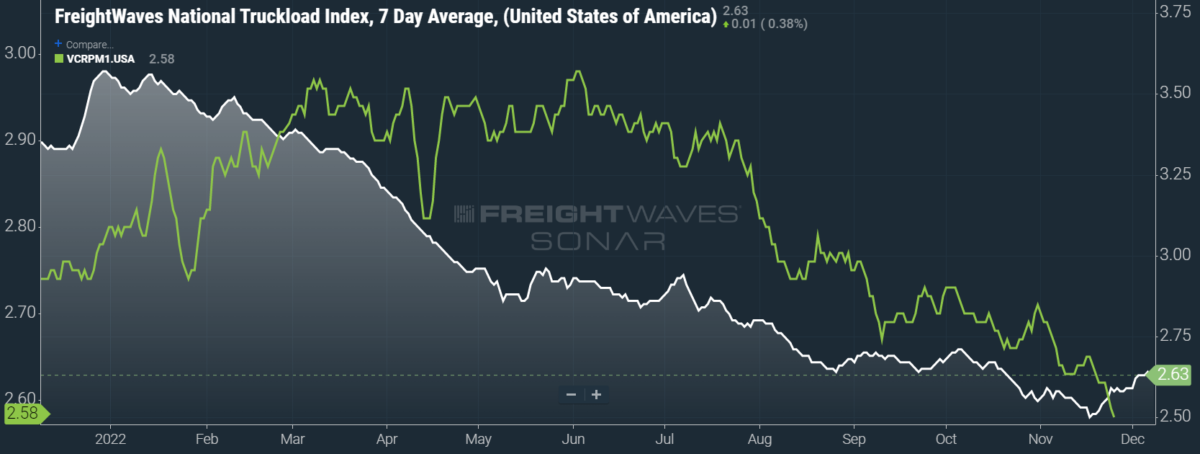
SONAR: National Truckload Index, 7-day average (white; right axis) and dry van contract rate (green; left axis).
To learn more about FreightWaves SONAR, click here.
Contract rates, which exclude fuel costs and other accessorials, fell 6 cents per mile w/w to $2.58 — pushing them back to levels last seen in August 2021. It is very likely that Q1 will see contract rates set the clock back even further, with a possibility of erasing all of 2021’s gains. Historically, the first and third quarters see the most activity in contract rate movement, since shippers’ bid cycles (which can vary in length) tend to align in these windows.
Spot rates, on the other hand, continue an upward push hindered by falling diesel prices. This week, the National Truckload Index (NTI), which includes fuel surcharges and other accessorials, rose 4 cents per mile w/w to $2.63. This latest rise puts a bit of breathing room between current levels and November’s low of $2.50 per mile.
The linehaul variant of the NTI (NTIL), which excludes fuel surcharges and other accessorials, rose 5 cents per mile w/w to $1.83. This 1 cent disparity reflects both the holiday pricing typically seen in the spot market and the decline of diesel prices, which are finally yielding to the recent nosedive of crude oil prices. Again, it is worth noting that while spot rates appear to be obeying historical trends, such behavior is itself unusual in the context of the current market’s deterioration.
To learn more about FreightWaves SONAR, click here.
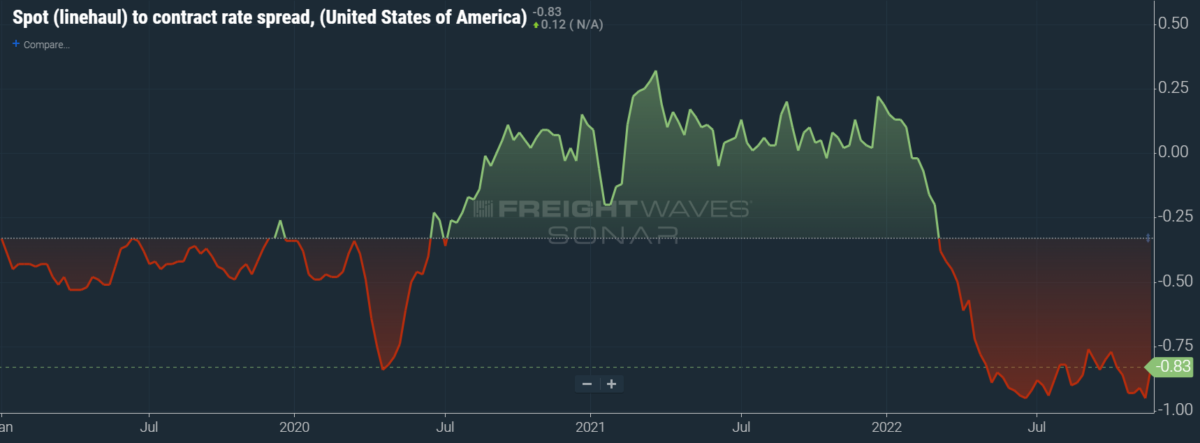
The chart above shows the spread between the NTIL and dry van contract rates, showing the index has continued to fall to all-time lows in the data set, which dates to early 2019. Throughout that year, contract rates exceeded spot rates, leading to a record number of bankruptcies in the space. Once COVID-19 spread, spot rates reacted quickly, rising to record highs on a seemingly weekly basis, while contract rates slowly crept higher throughout 2021.
As the linehaul spot rate remains 83 cents below contract rates, there is still runway for contract rates to decline throughout the next six months.
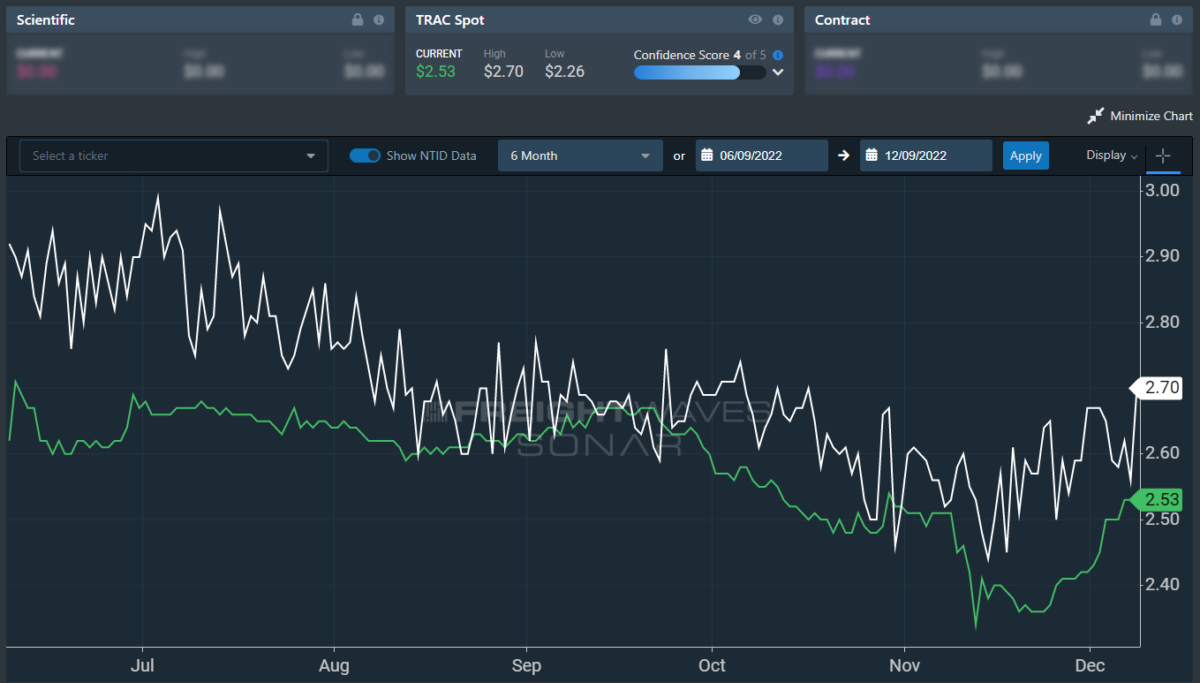
To learn more about FreightWaves TRAC, click here.
The FreightWaves TRAC spot rate from Los Angeles to Dallas, arguably one of the densest freight lanes in the country, is rebounding from its previous floor. Over the past week, the TRAC rate rose 10 cents per mile w/w to $2.53. The daily NTI (NTID), which has also risen to $2.70, continues to outpace rates from Los Angeles to Dallas.
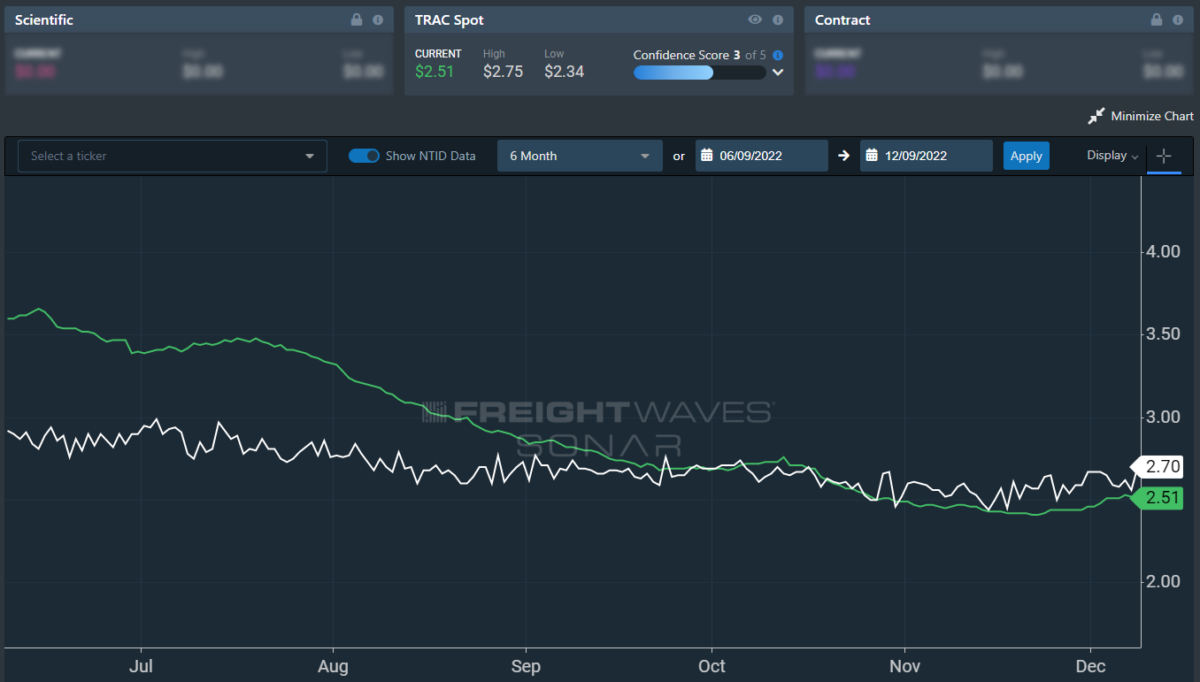
To learn more about FreightWaves TRAC, click here.
On the East Coast, especially out of Atlanta, rates also increased and are likewise underperforming against the NTID. The FreightWaves TRAC rate from Atlanta to Philadelphia rose 5 cents per mile this week to reach $2.51. Rates along this lane have been dropping stepwise since mid-July, when the TRAC rate was $3.48 per mile.
For more information on the FreightWaves Passport, please contact Kevin Hill at khill@freightwaves.com, Tony Mulvey at tmulvey@freightwaves.com or Michael Rudolph at mrudolph@freightwaves.com.
The post Contract market contracts, squeezing larger carriers appeared first on FreightWaves.
Source: freightwaves - Contract market contracts, squeezing larger carriers
Editor: Michael Rudolph