Freight News:
Cass: January shipments better than expected; TL takes share from other modes
More freight flowed into the truckload space during January, according to a Tuesday report from Cass Information Systems.
The shipments component of the Cass Freight Index was flat with December on a seasonally adjusted basis but down 3.2% on an unadjusted comparison. The index normally sees a low- to mid-single-digit sequential decline in January. Better weather during the month and improving auto production were cited as tailwinds.
On fourth-quarter earnings calls, some management teams mentioned the likelihood that January benefited from a backlog of shipments due to severe winter storms in late December.
| January 2023 | y/y | 2-year | m/m | m/m (SA) |
| Shipments | 4.3% | 1.3% | -3.2% | 0.0% |
| Expenditures | 1.7% | 33.4% | -3.2% | -0.2% |
| TL Linehaul Index | -5.6% | 6.5% | -0.9% | NM |
The report downplayed a 4.3% year-over-year (y/y) increase in shipments, chalking the gain up to an easy comp from a year ago when absenteeism was high due to the omicron outbreak. Also, weather was noted as a bigger overhang a year ago. The index was down 11% sequentially in January 2022, more than double the typical seasonal drop.
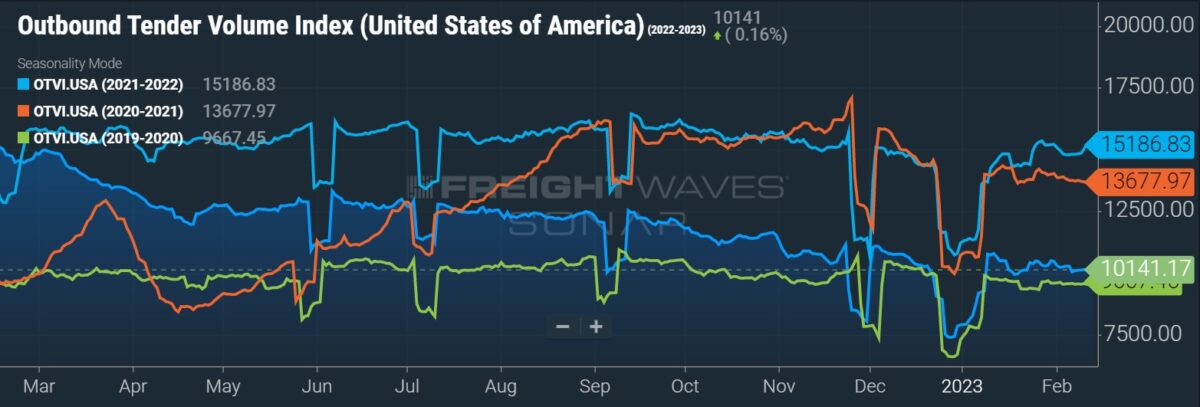
More contract and dedicated freight was in TL networks during the month, given a share shift from less-than-truckload and intermodal, the report said.
“There has been a considerable increase in the proportion of truckload (TL) freight over the past several months, suggesting freight is migrating to TL from other modes,” ACT Research’s Tim Denoyer commented in the report.
The expectation is for shipments to be flat y/y again in February and March assuming normal season patterns.
“After a soft holiday season with inventories overstocked and imports falling sharply, the outlook remains cautious, but volumes are on a high plateau,” Denoyer added.
Cass’ expenditures subindex, which includes the total cost of shipping freight, was basically flat month over month when seasonally adjusted, down 3.2% unadjusted. The index was 1.7% higher y/y.
Compared to two years ago the index was up 33.4% in January. Following increases of 23% in 2022 and 38% in ’21, the data set is expected to decline this year. Diesel prices, which are captured by the index, were up roughly 70% on average in January from two years ago.
With freight costs increasing at a slower pace y/y than shipments, it is inferred that freight rates were actually down 2.5% y/y in the month.
“Aside from some noise in this series as a result of fuel prices and modal mix, the trend has clearly turned lower over the course of 2022 and is poised to continue in this direction in the near term. This stability m/m is unusual,” Denoyer said.
The forecast calls for freight rates to drop 6% to 7% y/y over the next few months, assuming normal seasonality.
The TL linehaul index, which excludes fuel and accessorials, was down 0.9% from December, the eighth straight sequential decline. While the index was down 5.6% y/y it remained 6.5% higher than two years ago.
“As a broad truckload market indicator, this index includes both spot and contract freight. With spot rates already down significantly, the larger contract market is likely to continue adjusting down more gradually but in the same direction,” Denoyer said.
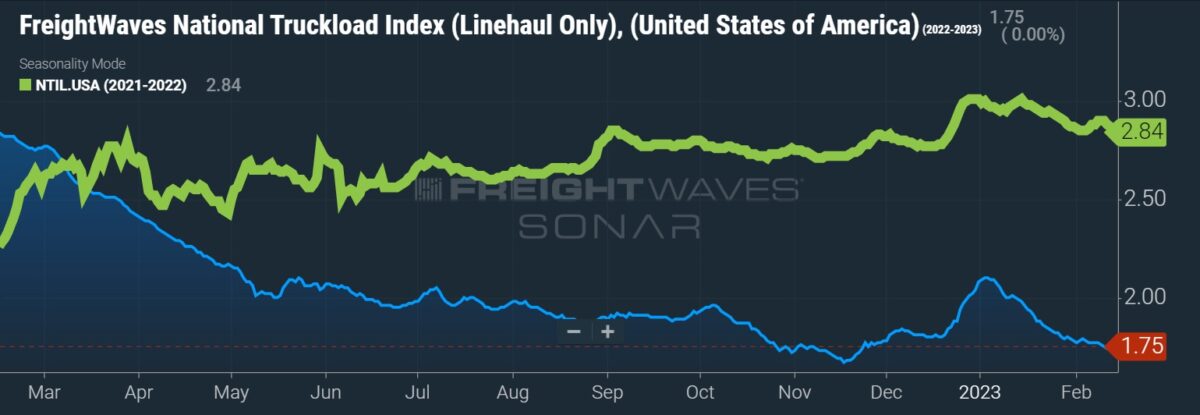
“Although LTL and intermodal volumes are down significantly, outperformance in truckload volumes shows the freight downturn is still likely to be mild overall,” Denoyer concluded. “We believe an accelerated bottoming process has begun in the freight rate cycle, with spot rates further below operating costs than ever before.”
Data used in the Cass indexes is derived from freight bills paid by Cass (NASDAQ: CASS), a provider of payment management solutions. Cass processes $37 billion in freight payables annually on behalf of customers.
More FreightWaves articles by Todd Maiden
- Saber-rattling begins ahead of LTL labor negotiations
- Radiant delays filing again; no date given for restatement of financials
- Yellow sees tonnage plummet, books Q4 loss
Spot rates continue to fall as markets deteriorate
videojs.getPlayer('1757821147711121843').ready(function() {
var myPlayer = this;
myPlayer.on("loadedmetadata", function() {
var browser_language, track_language, audioTracks;
browser_language = navigator.language || navigator.userLanguage; // IE <= 10
browser_language = browser_language.substr(0, 2);
audioTracks = myPlayer.audioTracks();
for (var i = 0; i < audioTracks.length; i++) {
track_language = audioTracks[i].language.substr(0, 2);
if (track_language) {
if (track_language === browser_language) {
audioTracks[i].enabled = true;
}
}
}
});
});
The post Cass: January shipments better than expected; TL takes share from other modes appeared first on FreightWaves.
Source: freightwaves - Cass: January shipments better than expected; TL takes share from other modes
Editor: Todd Maiden