Freight News:
Carriers will become own worst enemy as demand declines
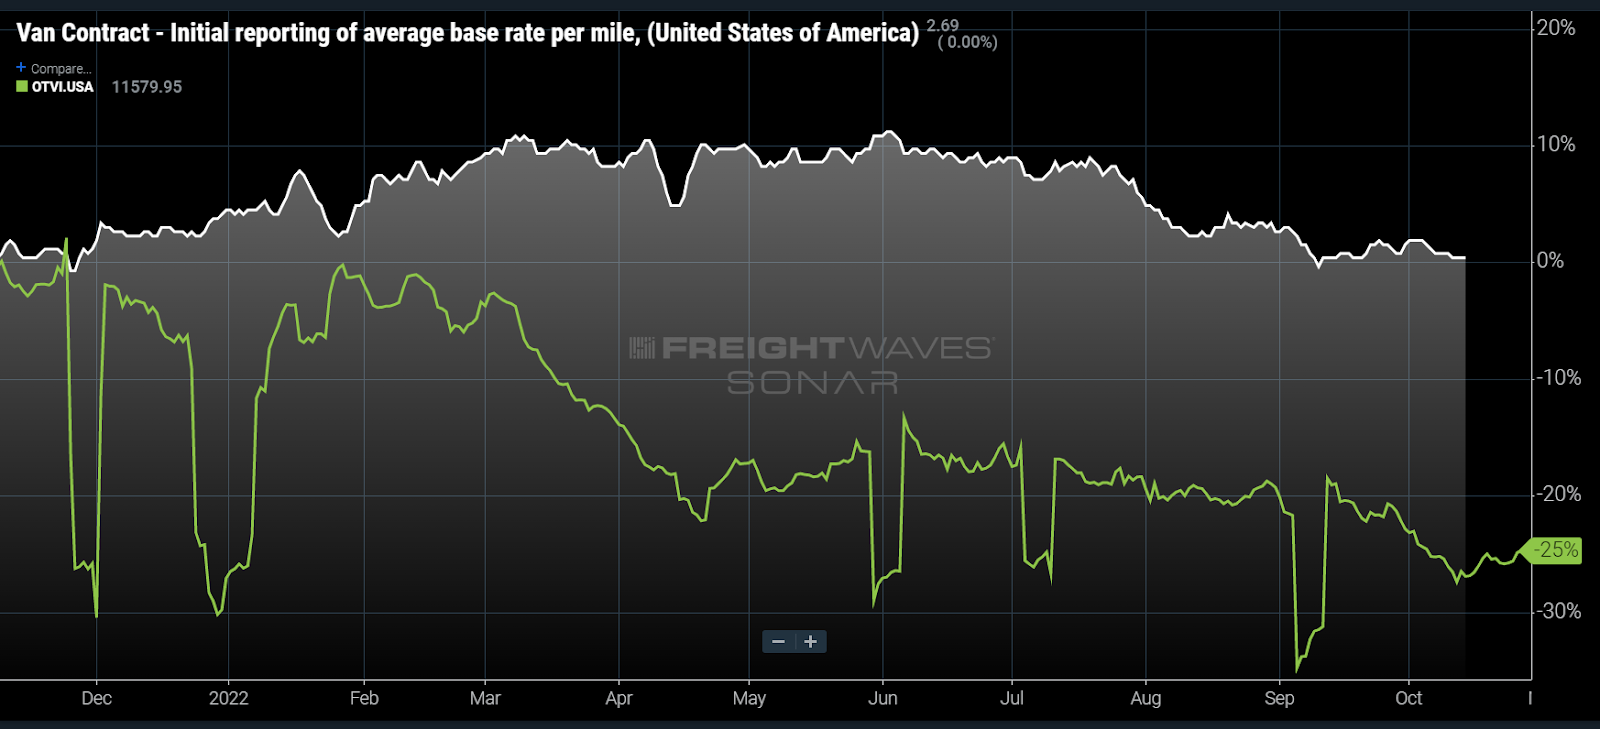
Chart of the Week: Van Contract Rate Initial Report, Outbound Tender Volume Index – USA SONAR: VCRPM1.USA, OTVI.USA
Dry van truckload contract rates have fallen about 9% since the start of the summer but have slowed their rate of descent this fall, according to FreightWaves’ Van Contract Initial Report Index (VCRPM1), which is based on the linehaul-only portion of freight invoices.
Is this a sign that shippers will not be aggressively peeling back the past two years of rate increases?
Dry van contract rates are still more than 35% higher than they were in June of 2020 but are essentially flat from a year-over-year (y/y) perspective. Contract rates “peaked” in June but were essentially flat from early March into July.
The pandemic-era tightness that began mid-2020 started an increasing trend of shorter cycle bids (aka mini-bids), which allowed contract rates to move faster than they historically have. Before 2020, the average bid cycle for shippers was around 12 months, meaning contract rates did not have strong fluctuations throughout the year.
The big question is how motivated or cognizant will shippers be as a sharp drop in demand has made capacity more easily attainable. The Outbound Tender Volume Index (OTVI) measures the total tenders or requests from shippers to carriers for capacity. Those requests are down 25% y/y.
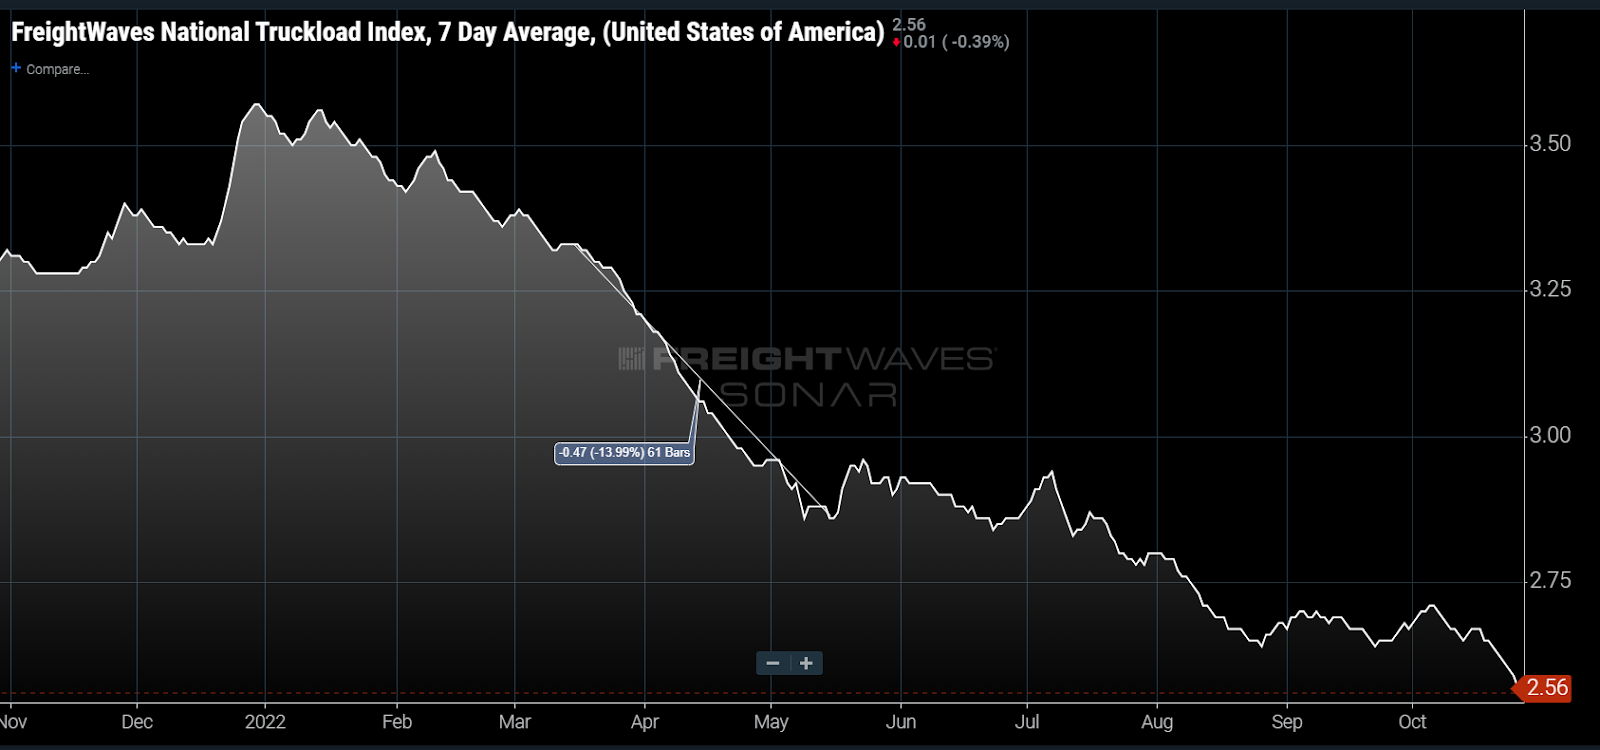
The truckload spot market responded quickly in March, with the National Truckload Index (NTI) falling 14% over a 61-day period. With spot rates being negotiated daily, they are faster to respond to changes in the supply and demand conditions of the market.
Shippers can get about a 24% discount on the spot market when sourcing capacity on average. This is not a sustainable relationship over time as contracts will move toward the spot market. For context, the spot market was offering a 12% discount in late October 2019 — widely considered a soft (deflationary rate) environment.
But in the near term there may be some hope for carriers as the contract market stalls. Why would this slowing occur?
Shifting concerns
Transportation is not the epicenter of the shipper universe any longer. Concerns for capacity have shifted to bloated inventories and demand forecasts. Getting these corrected has a greater potential impact on shippers’ bottom lines.
Bids take a lot of time and energy. Mini-bids do not mean shippers send out their entire network for pricing. These generally target the most problematic sections, which makes sense as the main goal is to save time and energy that results in higher costs. Now that the smoke is clearing from a capacity standpoint, they can catch their breath and reform strategy.
Shippers are also not vindictive entities wanting to drive carriers from the marketplace. That would be counterproductive. The ones with the best cost controls are typically those with the best-standing relationships with their partners. Most of them understand cost inflation has impacted everyone and is not quite fully baked. Bidding carriers below their break-even point does the shipper no good in the long run.
The truth is there is simply not a lot of bid implementation activity this time of the year. Mini-bids are largely a mechanism of desperation and not a way of life. Larger, less frequent stair steps will probably become the defining look of the contract rate index.
The problem that arises from the carriers’ side now is they are competing for a smaller amount of freight in what may become a desperate environment. This will be what ultimately drives contracts lower … and they will go lower.
About the Chart of the Week
The FreightWaves Chart of the Week is a chart selection from SONAR that provides an interesting data point to describe the state of the freight markets. A chart is chosen from thousands of potential charts on SONAR to help participants visualize the freight market in real time. Each week a Market Expert will post a chart, along with commentary, live on the front page. After that, the Chart of the Week will be archived on FreightWaves.com for future reference.
SONAR aggregates data from hundreds of sources, presenting the data in charts and maps and providing commentary on what freight market experts want to know about the industry in real time.
The FreightWaves data science and product teams are releasing new datasets each week and enhancing the client experience.
To request a SONAR demo, click here.
The post Carriers will become own worst enemy as demand declines appeared first on FreightWaves.
Source: freightwaves - Carriers will become own worst enemy as demand declines
Editor: Zach Strickland, FW Market Expert & Market Analyst